Sales Reports pull together data about your sales from the Exatouch database.
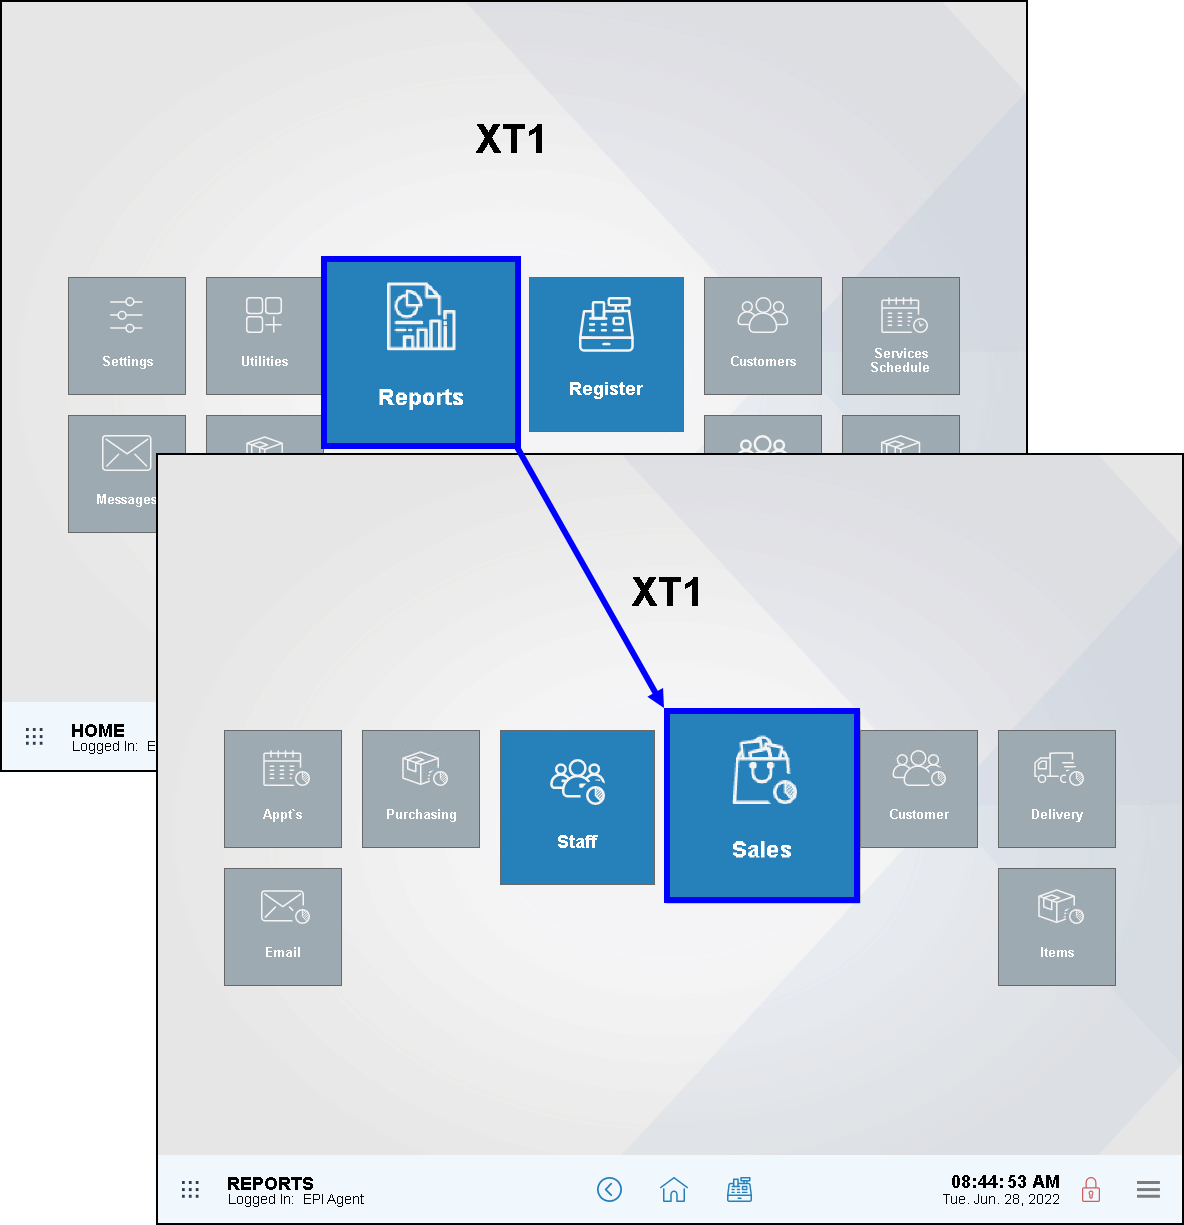
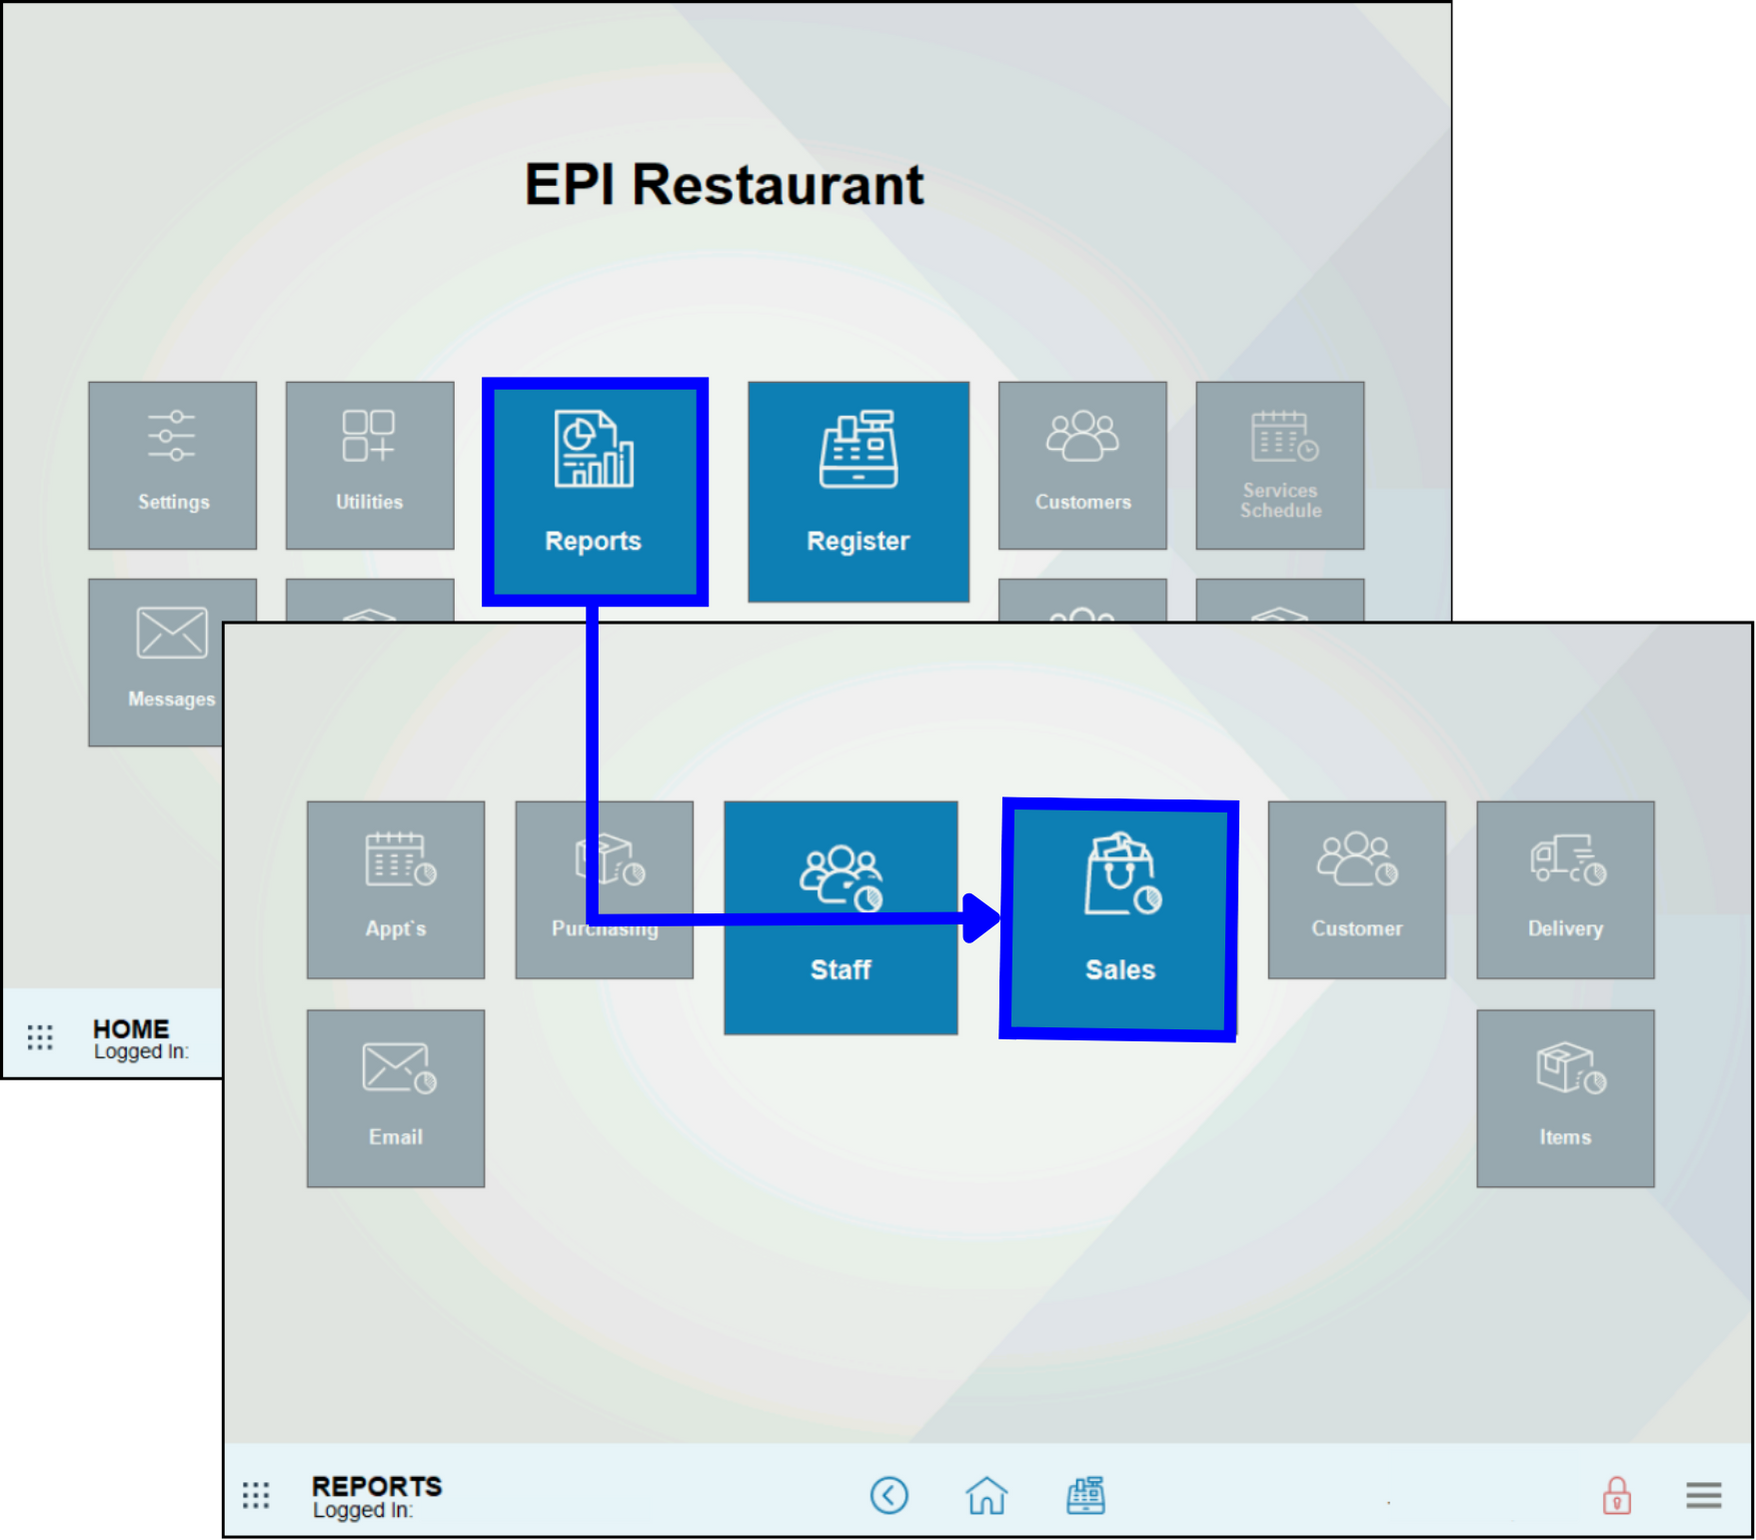
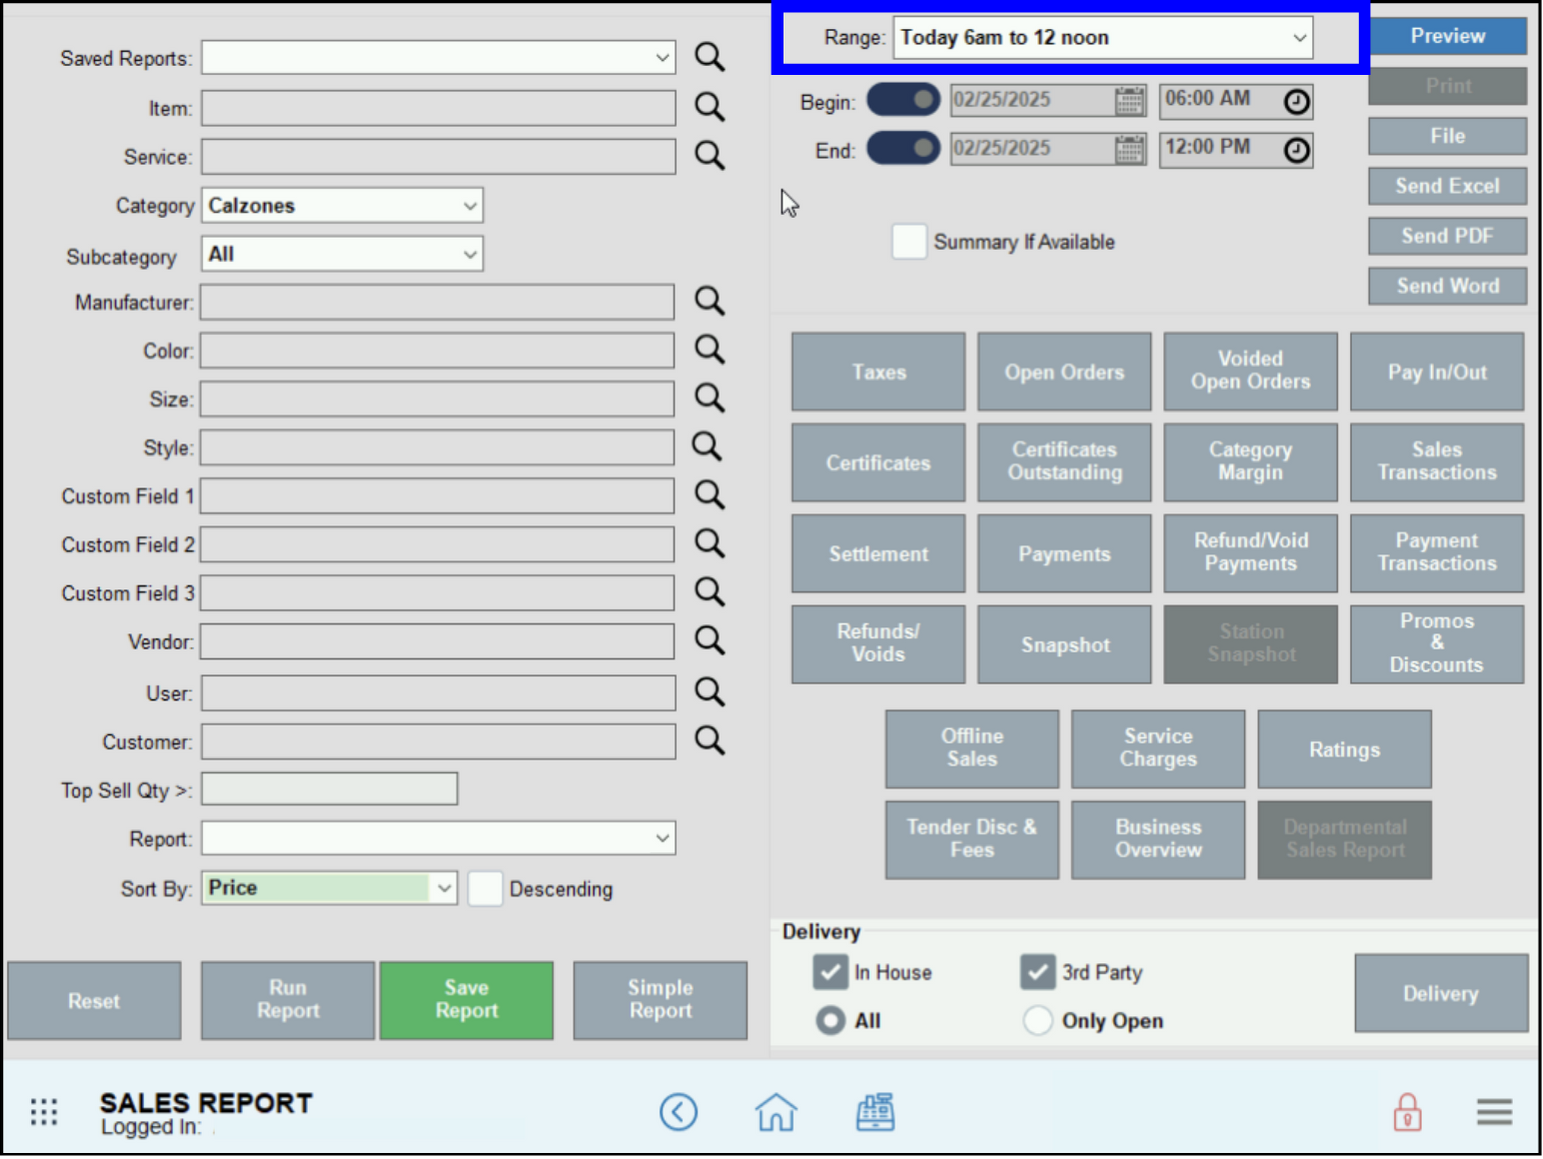
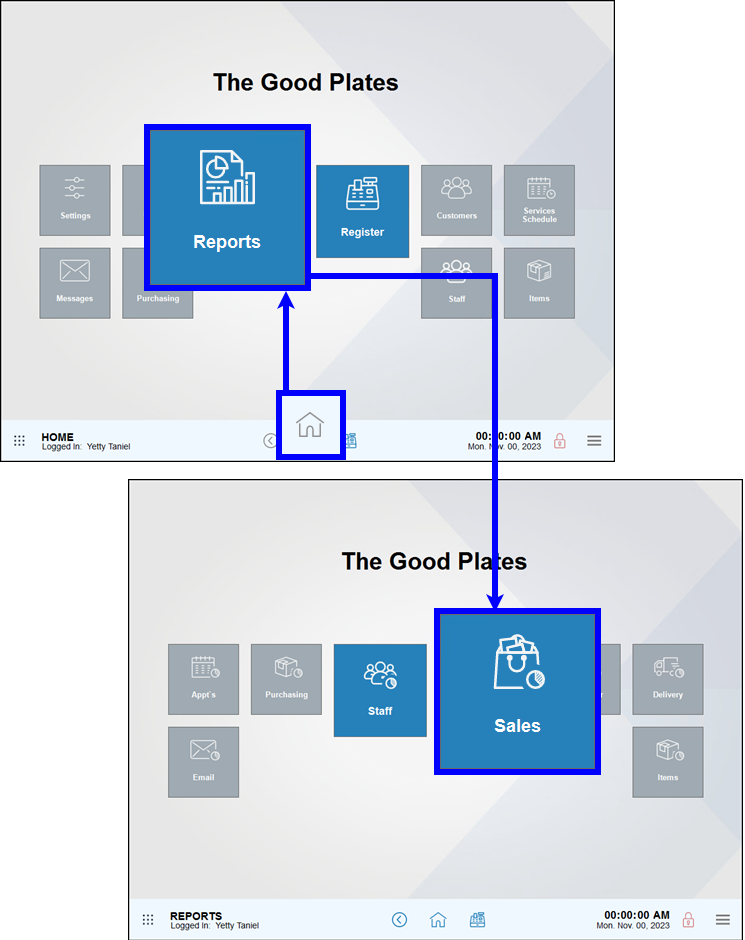
To run or set up a report to print or email, go to Home >Reports > Sales. Select a date range, provide other information as needed, and then tap a report to generate the report. Many reports are available in both full and summary formats.
- Note: The Exatouch system must be powered on and connected to the internet to generate and delivery scheduled reports.
- Go to Home > Reports > Sales to display the Sales work area.
- Select a range of dates and times for this report (pre-defined or custom).
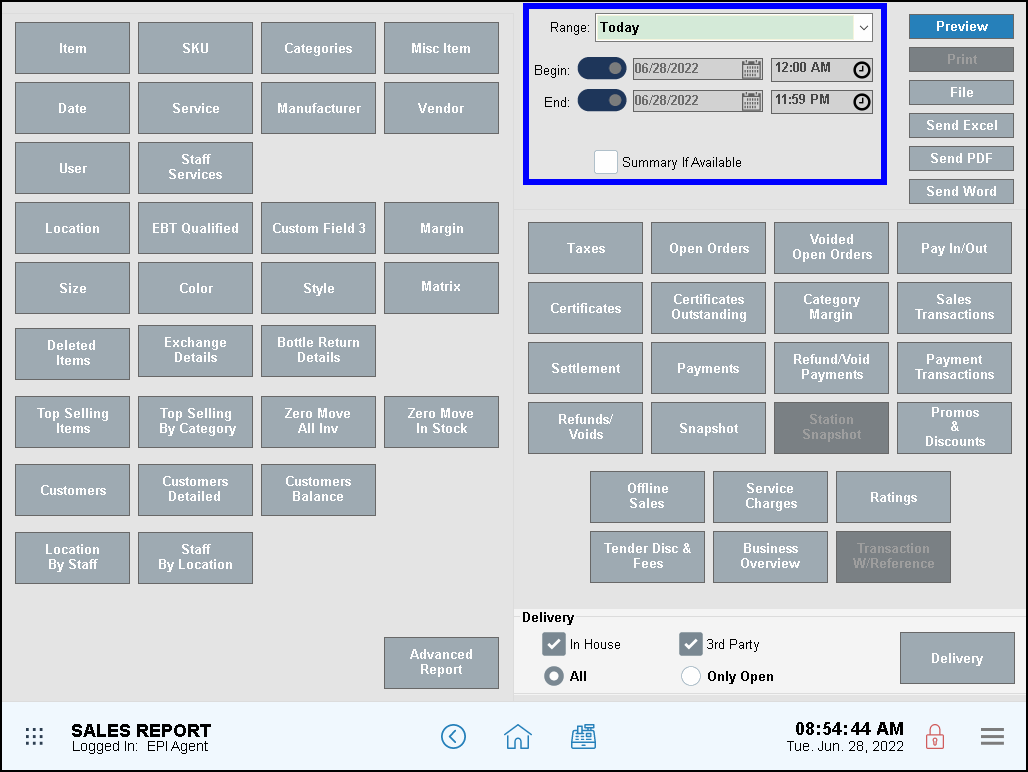
- Select a report format option.
- Preview – Generate and display the report on screen.
- Print – Generate and print to your report printer.
- File – Save to an inserted USB thumb drive.
- Send Excel – Generate and prepare to send in Excel format as an email attachment.
- Send PDF – Generate and prepare to send in PDF format as an email attachment.
- Send Word – Generate and prepare to send in Word format as an email attachment.
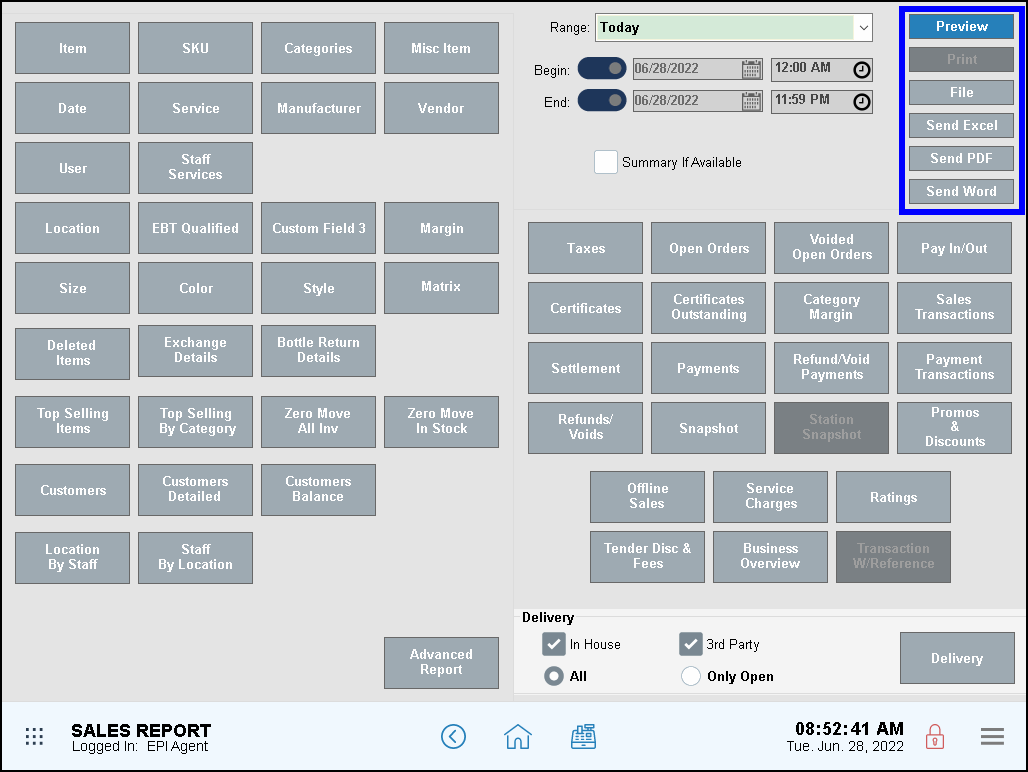
- Tap the name of the report to run.
- Review, send, or save the report.
Sales Report Descriptions
Report descriptions are listed alphabetically below, by report name:
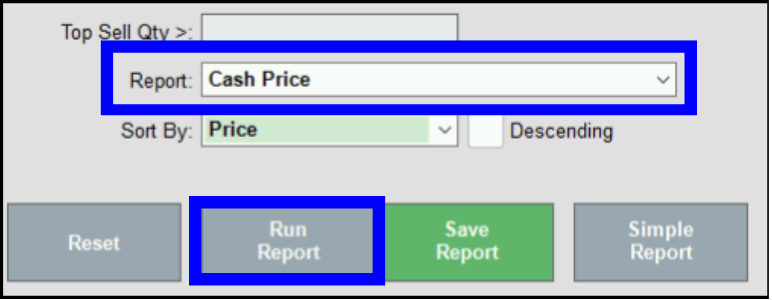
A Cash Price reports enable merchants to compare the cash and list prices for items, and highlight any differences.
- Go to Home > Reports > Sales.
- Fill in the Date Range and other advanced reporting options.
- In the Report field dropdown, select Cash Price.
- Click Run Report.
- The Cash Price report may be printed, saved, or exported.

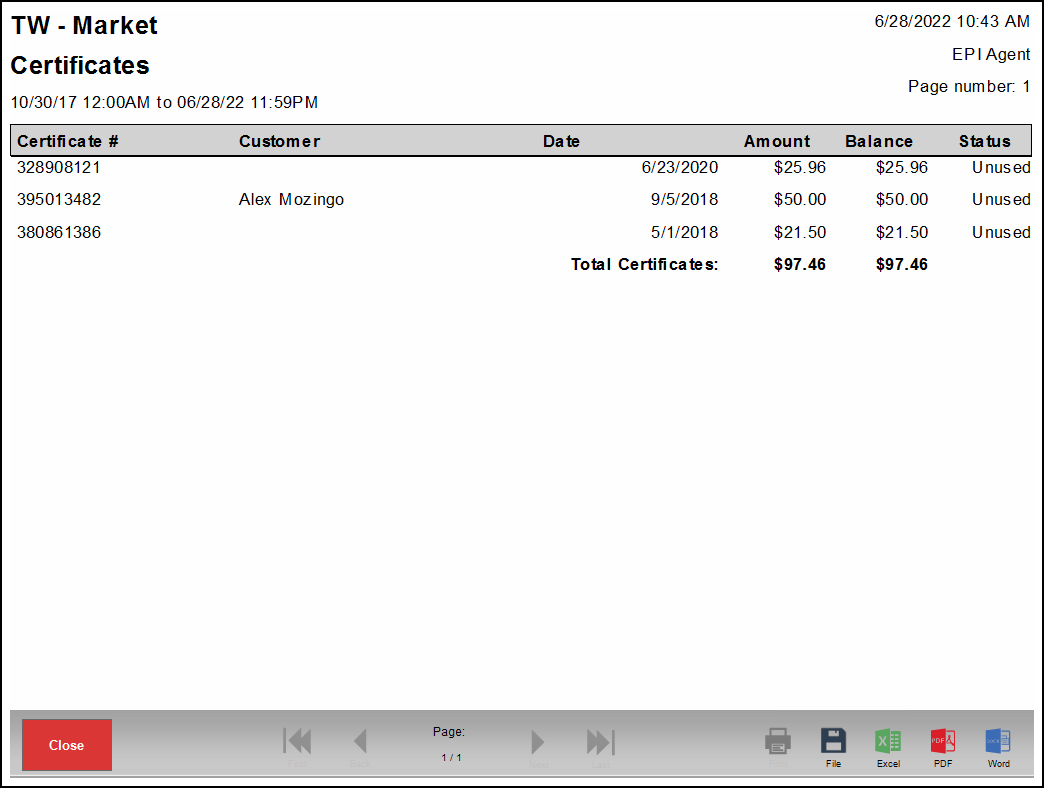
Certificates reports provide a list of all Exatouch gift certificates issued and used.
- Certificate # – Certificate numbers are created for every gift certificate issued. Customers use this number when redeeming gift certificates.
- Customer – Displays customer information (if any).
- Date – The date the gift certificate was issued.
- Amount – Original gift certificate amount.
- Balance – Remaining gift certificate balance. If there is no balance, $0.00 displays.
- Status – Displays whether a customer has used a gift certificate. Options include: Used, Unused, and Partial.
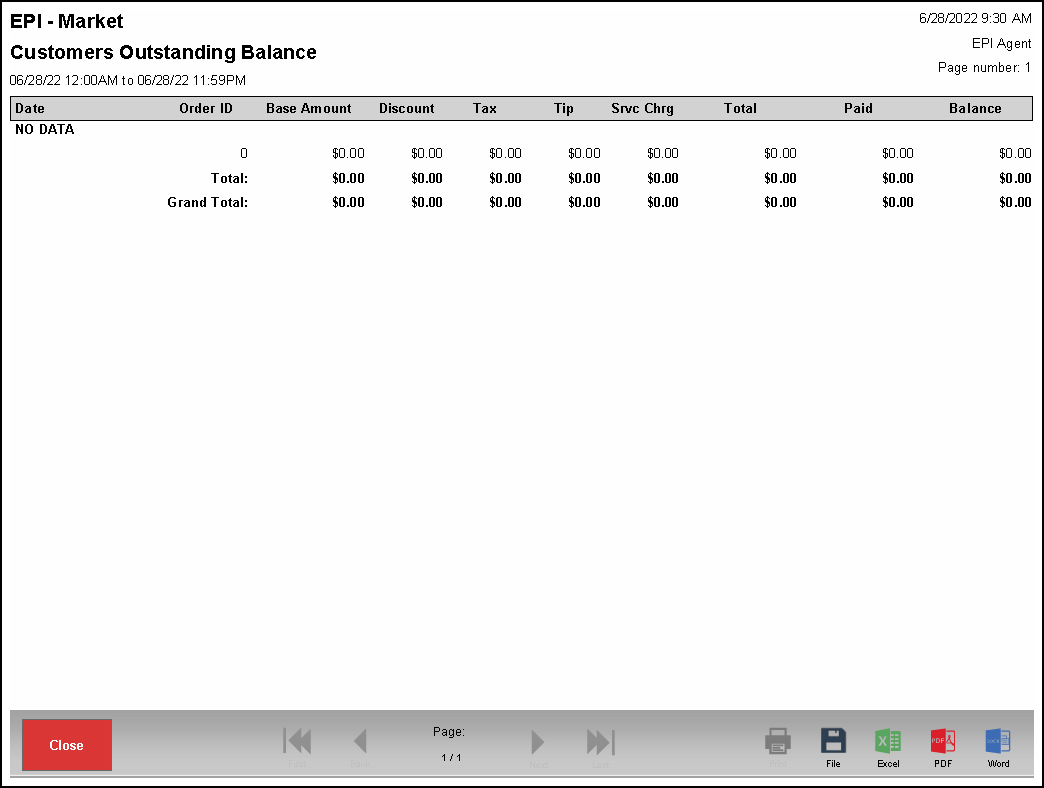
If you accept partial payments on orders and maintain outstanding orders for select customers, use this report to identify customers with an open balance. Summary versions of this report are available.
- Date – Date of the order.
- Order ID – Order number.
- Base Amount – The price before any discounts, taxes, tips, or other fees are applied.
- Discount – All manual and automatic discounts applied to items, excluding tender type discounts.
- Tax – Taxes charged.
- Tip – Tips received.
- Srvc Chrg – The Admin Fee set in account settings.
- Total – Total of the entire order.
- Paid – Portion of the order paid. This value will be less than the Total is the order is only partially paid.
- Balance – Portion of the order remaining. This will display as zero unless there is a remaining balance.
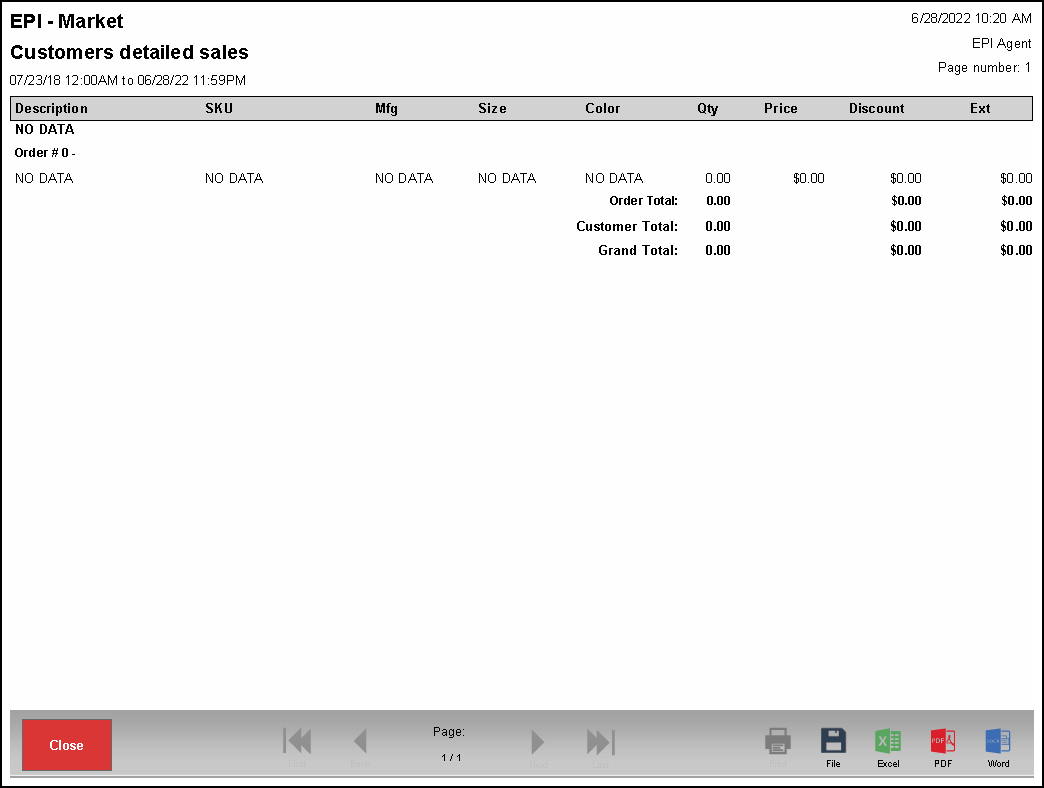
Customers Detailed Sales Reports display items sold or refunded during a given time period. Reports are grouped together by customer.
Each items have totals for the Qty and Ext columns. The Grand Total provides total sums for the Qty, Discount, and Ext columns at the end of the report.
- Description – Name of the item the customer purchased.
- SKU – Lists saved SKU numbers for items sold.
- Mfg – The name of the manufacturer listed on Items Details page displays here.
- Size – Item size as saved on the Items Details page. This is not the Pack Size from the Pricing tab.
- Color – Item color as saved on the Items Details page.
- Qty – The quantity sold displays in this column.
- If Auto Group Items is enabled, all like items on an order populate in the same record.
- If Auto Group Items is disabled, items will show as separate records.
- For refunds, the record displays as a negative number.
- For weighted items, the record displays the unit quantity.
- Price – The price before applying any discounts, fees, or taxes (i.e., just the item price).
- For weighted items, the price is per unit.
- For refunds, this value sometimes displays as negative.
- Discount – All manual and automatic discounts applied to items, excluding tender type discounts. Discounts are always a negative value.
- Ext – Displays the price (excluding discounts) for every record in the report. For refunds, this value sometimes displays as negative.
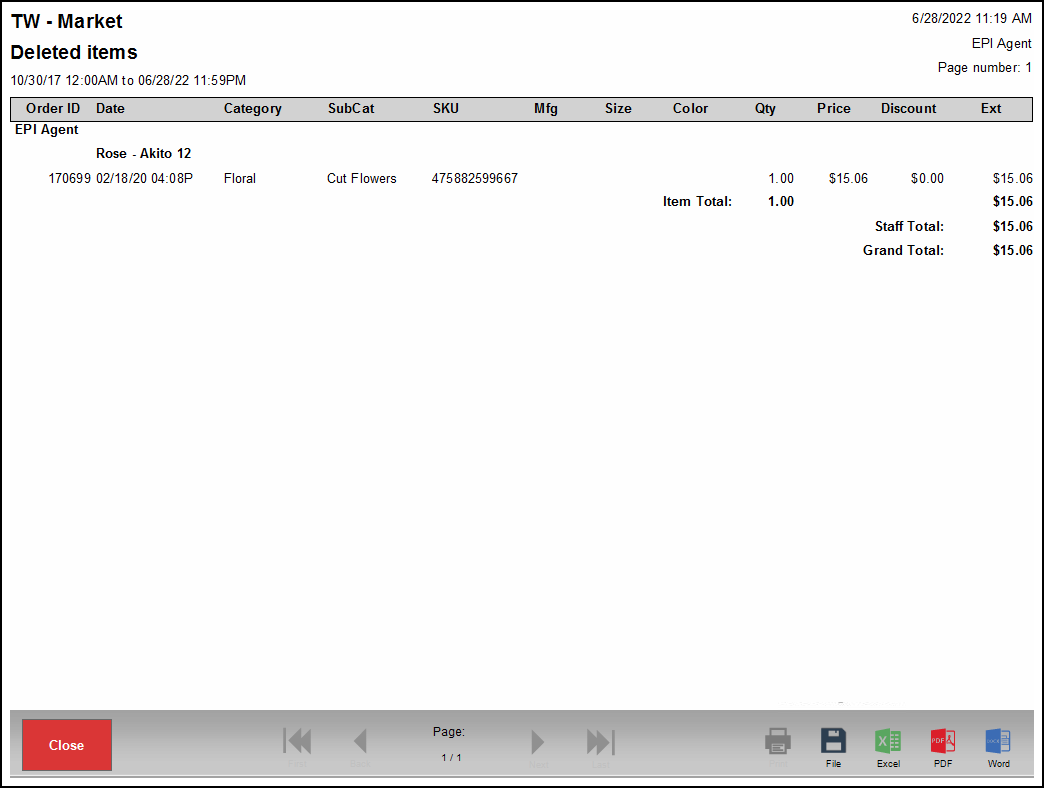
Deleted Items reports display items removed from orders when using the Remove Line button in the Register.
Reports are grouped by deleted items. An item may have many records of deletion underneath.
Each item has totals for the Qty and Ext columns. The Grand Total provides total sums for the Qty, Discount, and Ext columns at the end of the report.
- Order ID – Order number from which the item was deleted.
- Date – Date and time an item was deleted.
- Category – Displays the category to which the item belongs. Categories selected in a Misc. Sale display here.
- SubCat – Displays the subcategory to which the item belongs. Subcategories selected in a Misc. Sale display here.
- SKU – The SKU used in the order.
- Mfg – The manufacturer from the Items Details page displays here. This can be helpful for Scan Data merchants.
- Size – Item size as saved on the Inventory tab of the Items Details page.
- Color – Item color as saved on the Inventory tab of the Items Details page.
- Qty – Quantity of the item removed.
- If Auto Group Items is enabled, all like items on an order display in the same record.
- If Auto Group Items is disabled, items display as separate records.
- For refunds, the record displays as a negative number.
- For weighted items, the record displays the unit quantity.
- Price – The price before applying any discounts, fees, or taxes (i.e., just the item price). For weighted items, the price is per unit.
- For weighted items, the price is per unit.
- Discount – All manual and automatic discounts applied to items, excluding tender type discounts. Discounts are always a negative value.
- Ext – Displays the price (excluding discounts) for every record in the report.
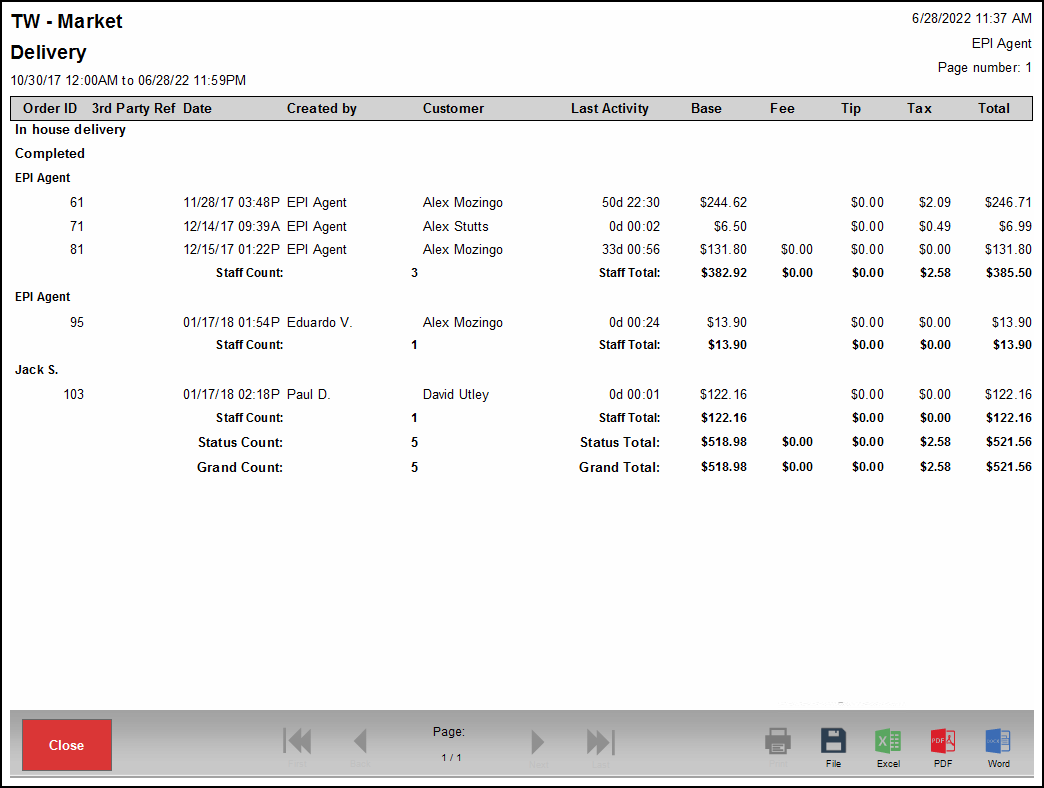
Delivery sales reports list all delivery orders. Merchants can view in-house or third-party delivery orders, or both. Merchants can also choose to view only their open delivery orders or all open delivery orders.
- Order ID – Order number created for the sale.
- 3rd Party Ref – The reference number for a third-party delivery service item.
- Date – Date and time the order was opened.
- Created by – The employee who created the report.
- Customer – Customer to whom the order was delivered.
- Last Activity – Time elapsed since order was last updated or completed.
- Base – Amount of all items before any discounts, taxes, fees, or tips.
- Fee – Delivery fees associated with the order.
- Tip – Tips accepted for the delivery order.
- Tax – Taxes charged.
- Total – Total of the entire order.
Departmental Sales reports provide merchants with a breakdown of gross sales by item.
- Departments – List of items divided by department: Non-revenue, Revenue, and Seasonal.
- Total $ – Sum of all purchases per item and item total.
- Sales % – Indicates what percent of sales each item contributed to for the reporting period.
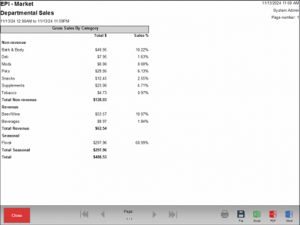
See Utilizing Item Departments for more information.
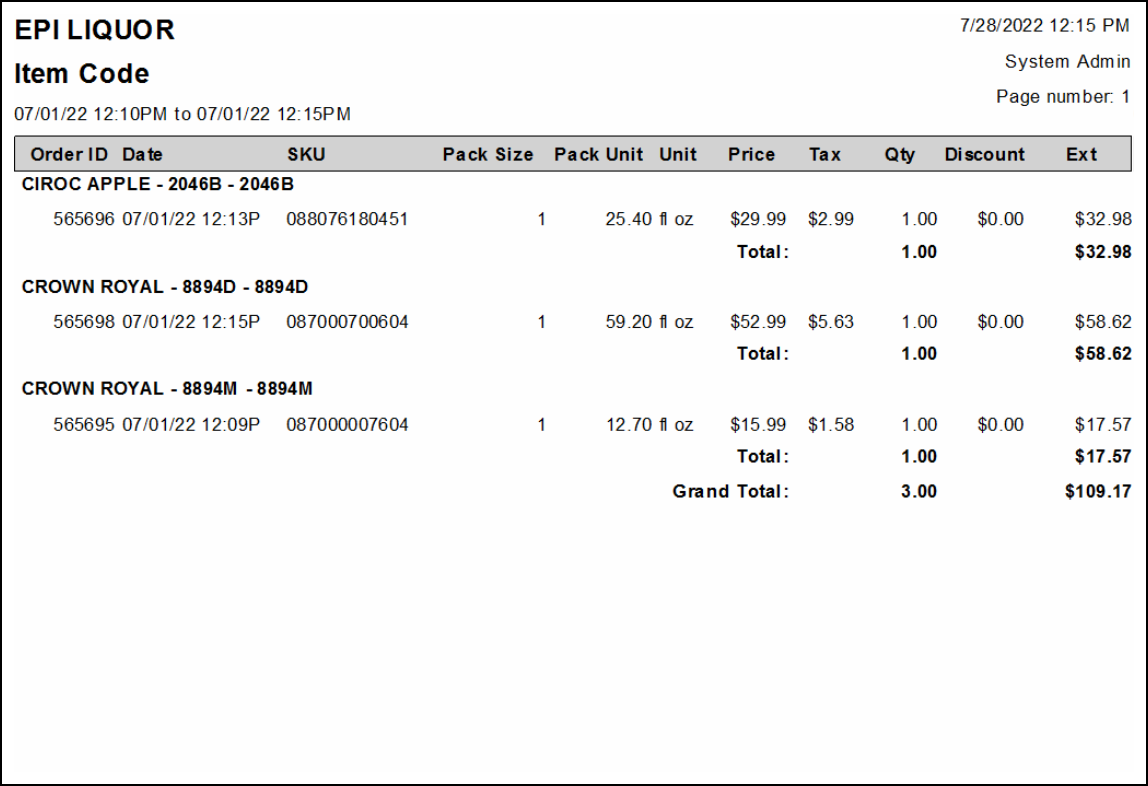
Displays all liquor items sold with associated item codes. Note: This report is relevant for Michigan liquor merchants.
- Item Description – Description of the item.
- Item Code – The state liquor tax code.
- Order ID – Each time an item is sold or refunded, an Order ID record is created.
- If Auto Group Items is enabled, all items on an Order ID display grouped together.
- If Auto Group Items is disabled, items display as separate records.
- Date – The date and time of the transaction.
- SKU – The SKU used in the order.
- Pack Size – The pack size as defined on the Items Pricing tab (i.e., six-pack, 24-pack, etc.).
- Units – Unit of measurement of the item (i.e., fluid ounces, pounds, kilograms).
- Sell Price – Price of the item without taxes or fees.
- Qty – The quantity sold.
- If Auto Group Items is disabled, items display as separate records.
- If a refund is issued, the record displays as a negative number.
- Discount – All manual and automatic discounts applied to items, excluding tender type discounts. Discount always displays as a negative number.
- Extended Price – The price including taxes and discounts.
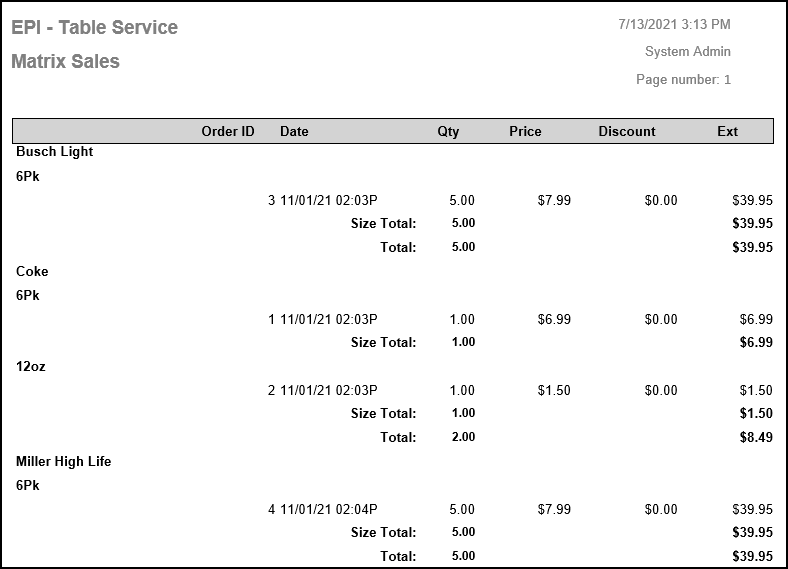
Matrix Item sales reports display items that share a SKU with different attributes, and provide a breakdown of matrix items that were sold. Reports are grouped according to matrix group, with members displaying underneath. Note: This report is relevant for Michigan liquor merchants.
Each item has totals for the Qty and Ext columns. The Grand Total provides total sums for the Qty, Discount, and Ext columns at the end of the report. Refund by Item creates records for this report.
- Order ID – Each time an item is sold or refunded, an Order ID record is created.
- If Auto Group Items is enabled, all items on an Order ID display grouped together.
- If Auto Group Items is disabled, items display as separate records.
- Date – Displays the date and time of the transaction.
- Qty – Displays the quantity sold.
- If Auto Group Items is disabled, items display as separate records.
- If a refund is issued, the record displays as a negative number.
- Price – Price before applying any discounts, fees, or taxes.
- For weighted items, this displays as price per unit.
- This value is sometimes negative when a refund is made.
- Discount – All manual and automatic discounts applied to items, excluding tender type discounts. Discount always displays as a negative number.
- Ext – Displays the price (excluding discount) for every record in the report. This value sometimes displays as negative, indicating a refund was made.
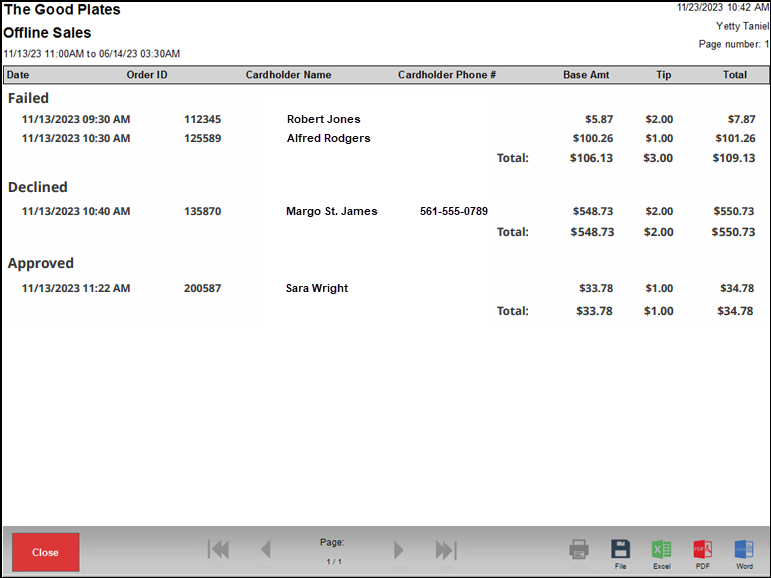
Column information, from left to right, includes:
- Date – The date and time of the original transaction.
- Order ID – Exatouch order number.
- Cardholder Name – Cardholder name, as entered by staff.
- Cardholder Phone # – Cardholder phone number, as entered by staff (or drawn from the customer record).
- Base Amt – The total before tip, after tax and other fees and discounts, of the order.
- Tip – The tipped amount of the order.
- Total – The complete order total.
Offline Sales are divided into three categories:
- Failed – transactions processed offline, and subsequently failed during batch settlement. Failed orders remain in the offline batch. Run the batch again or contact Support for assistance with these transactions.
- Declined – transactions processed offline, and were declined during batch settlement. Declined orders are returned to the open orders queue. Use Get Order in the Register app to retrieve the order and process another payment transaction.
- Approved – transactions approved during batch settlement.
Each transaction category group includes a group Total at the bottom of the group.

- From Home, navigate to Reports > Sales.
- Select a specific or custom date Range.
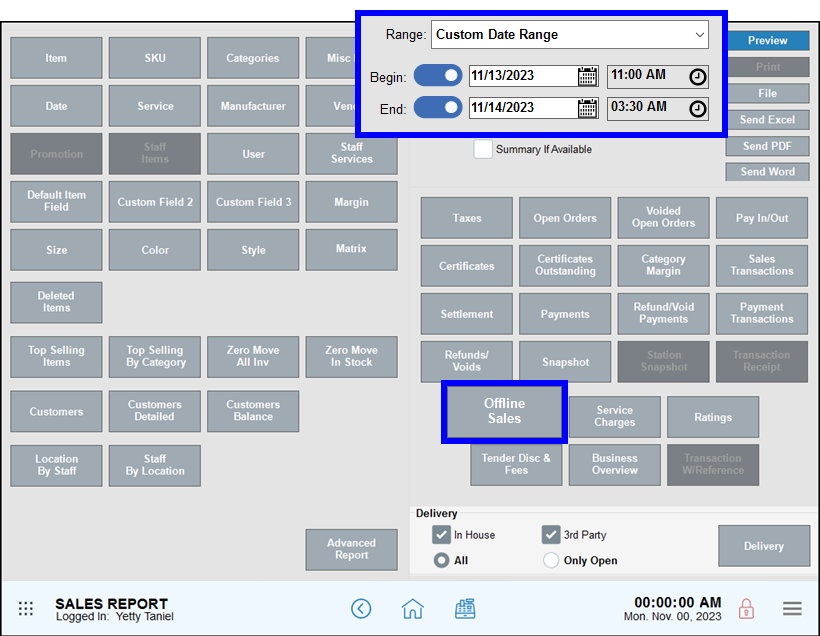
- Tap Offline Sales to generate your report.
- Review the report using the page scroll options, save the report to a USB, or email your report in Excel, PDF, or Word format.
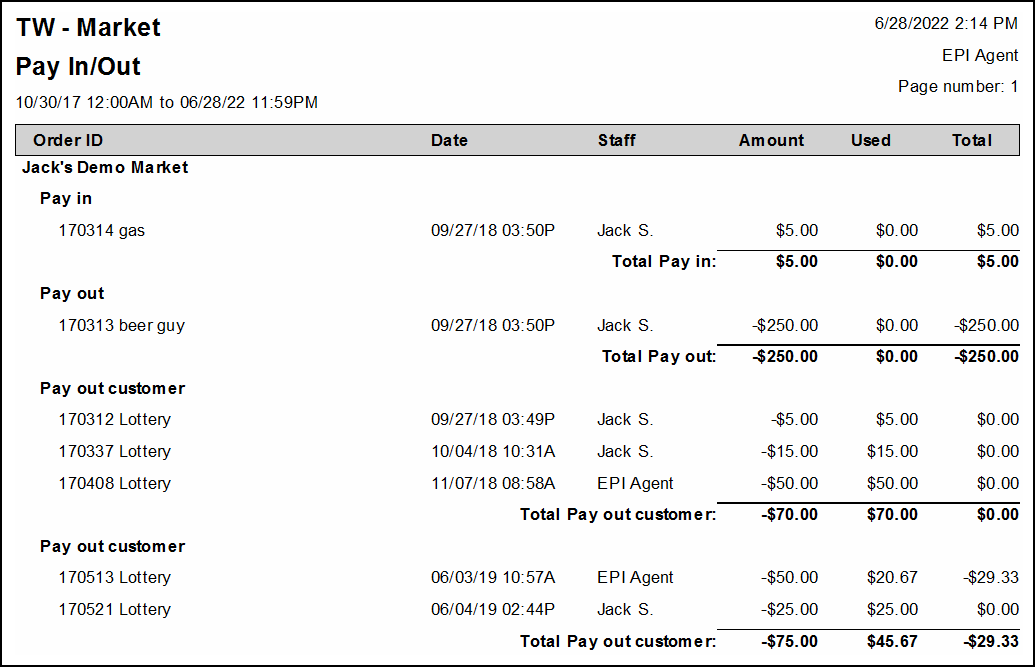
Pay In/Out reports track all pay-ins and pay-outs for both the company and customers. Reports are organized according to the reason for the pay-in/pay-out.
- Order ID – Order ID and reason.
- Date – Date and time of the transaction.
- Staff – Staff member who issues the pay in/out.
- Amount – The amount of the pay in/out.
- Used – Value of the pay out that went toward paying for an order.
- Total – Total cash taken from or added to the cash drawer. For Customer Payouts, this number may change if a purchase is made in the Register.
Payment Transactions reports give merchants totals from payments taken on orders created in the Register. Reports are grouped by station, and then by date.
- Date – Date and time of the transaction.
- Order ID – Order ID from the sale. This report creates a record per Order ID created, not per payment.
- Cash – Cash amount paid for an order.
- CC/Debit/EBT – Credit, debit, and EBT amount paid on an order.
- Gift – eGift and gift certificate amount paid on an order.
- Check – Check amount paid on an order.
- Discount – Discount amounts given on an order.
- Reward – Amount of an order paid for using loyalty rewards points.
- Payout – Amount of an order paid for using a customer payout.
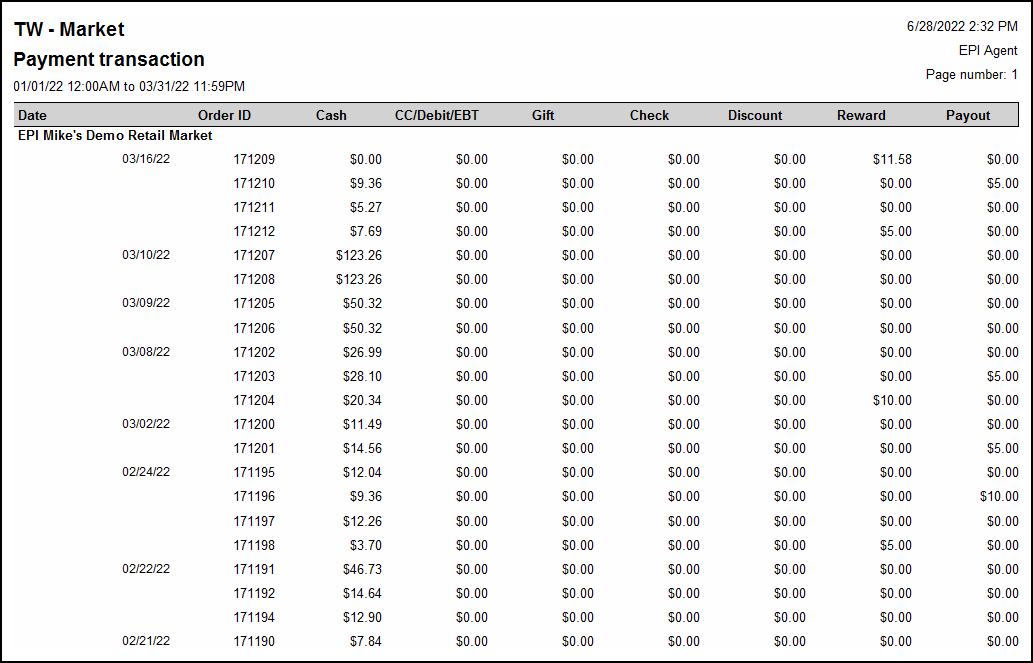
A total row with each column’s total displays at the bottom of the station’s section. The end of the report displays each column’s total.
If only one tender type is used on an order, that tender’s column has a value in it. Otherwise, the column displays as $0.00. If multiple tenders are accepted, they display under their appropriate column.
Payments reports display totals from payments taken on orders from the Register. For merchants who process tips, credit payments display under the Authorized category until they have been adjusted or batched. Once adjusted or batched, payments display under Paid.
- Order ID – Order ID from the sale. This report creates a record per Order ID created, not per payment.
- Date – Date and time of the transaction.
- Staff – Staff member who accepted the payment.
- Type – The payment type accepted, e.g., cash, discount, debit, EBT, certificate, eGift, reward, check, or third-party delivery.
- Reference – Check reference added in the sale.
- Amount – Amount of the payment accepted.
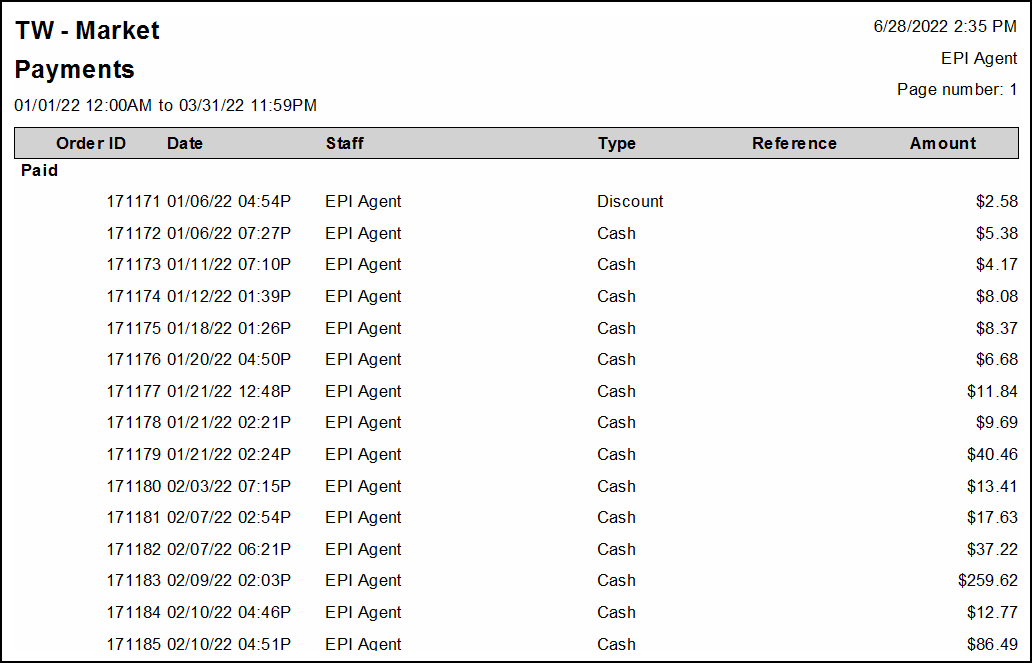
Total and Grand Total values display at the very end of the report. Tab auths do not display until the tab is completed. Once completed, tab auths display as Credit.
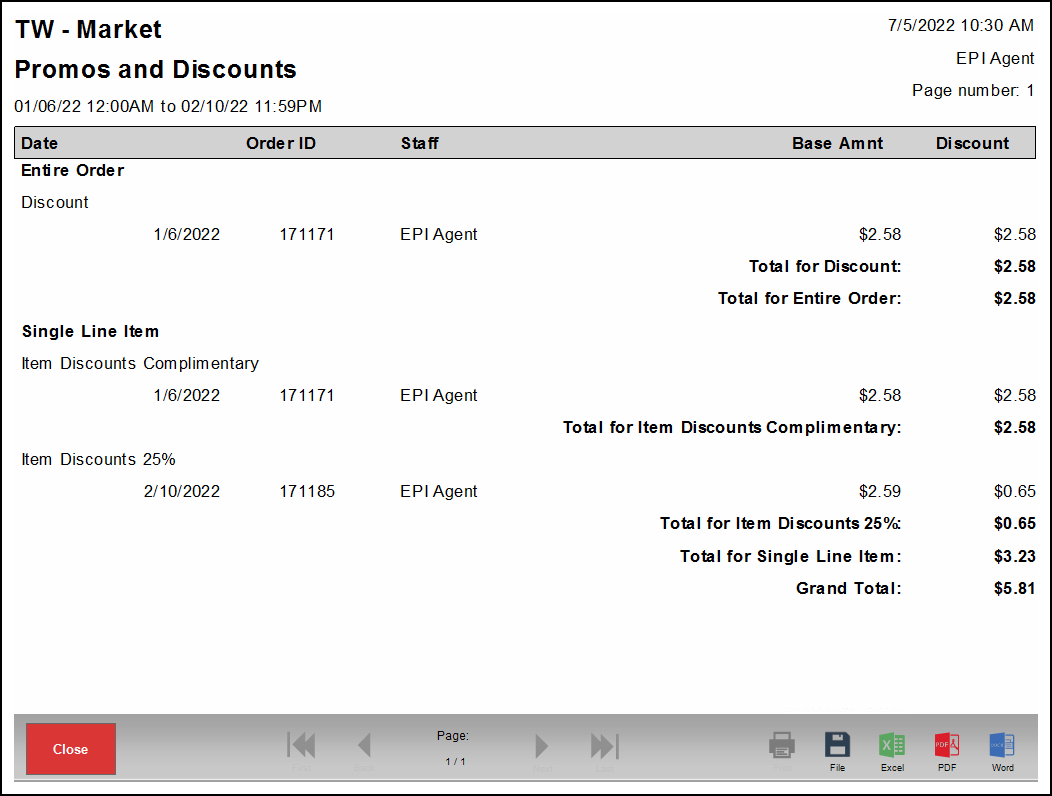
The Promos & Discounts report gives a broad look at all items sold below established retail cost. Items are grouped by discount type, such as item level promotions, discounts on entire orders, and more. No summary version of this report is available.
- Date – Date the transaction occurred.
- Order ID – Order number created for the sale.
- Staff – Employee who handled the sale.
- Base Amt – Cost, excluding discounts, taxes, tips, and other fees.
- Discount – The discount issued on a line item or entire order.
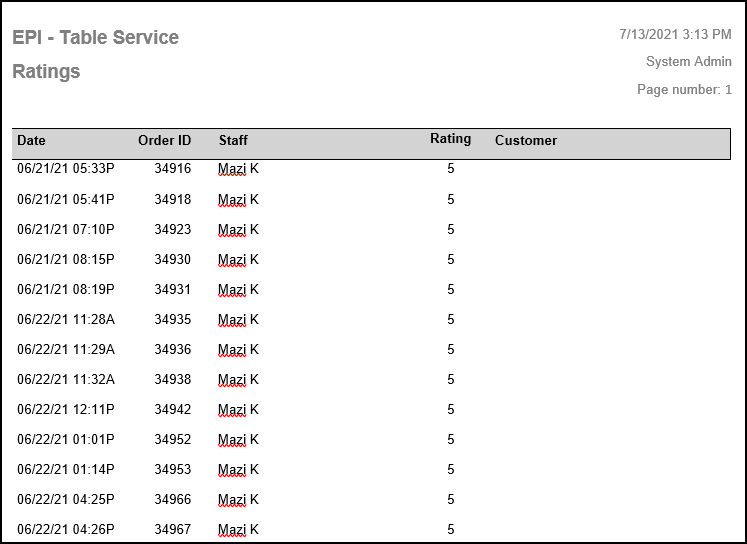
Ratings report provide data from star ratings entered on the customer facing display. Reports display in chronological order. Each order displays for the time range selected.
- Date – Date and time of the order.
- Order ID – Order number from the sale.
- Staff – Employee who handled the sale.
- Rating – Rating (1-5) entered by the customer.
- Customer – Customer record attached to the order (if applicable).
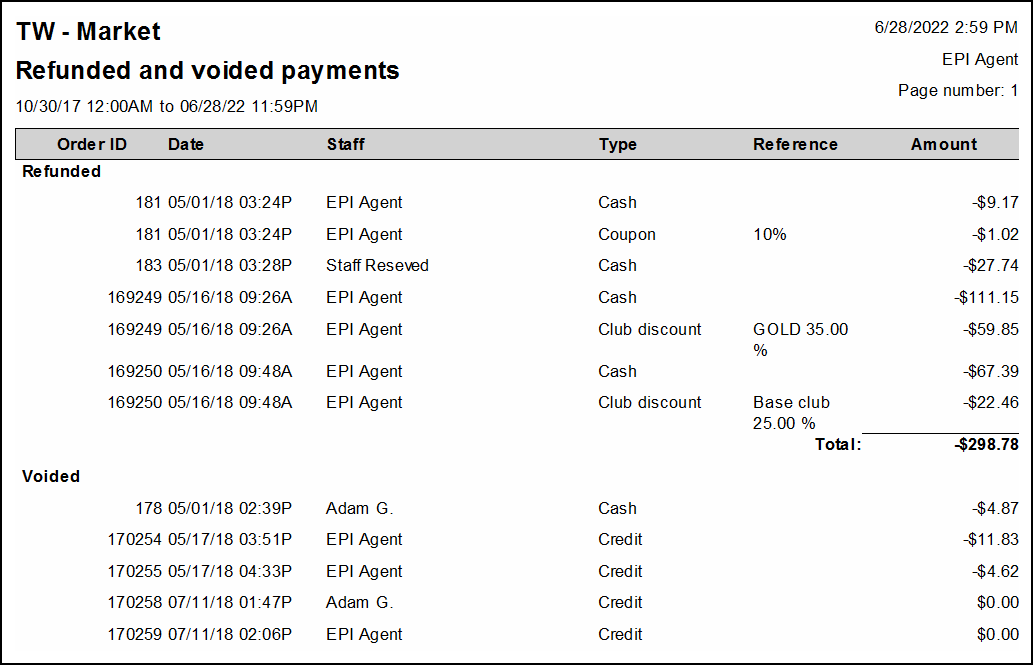
The Refund/Void Payments reports track what kinds of refunds are processed based on payment type, such as cash, debit, or cash. Reports are grouped by transaction type, including Refunded, Voided, and Open Refund.
- Order ID – Order number of the transaction. Voids and the original sale have the same Order ID. New Order IDs are created for every refund that is performed.
- Date – Date and time transaction was processed.
- Staff – Staff member who processed the refund or void.
- Type – The tender type used to issue the refund.
- Reference – The reference number assigned to the refund or void.
- Amount – Total amount of the issued refund or void. This will always consist of the entire amount issued unless the void is processed from the Complete Auth menu. For voids processed from the Complete Auth menu, the amount is zero.
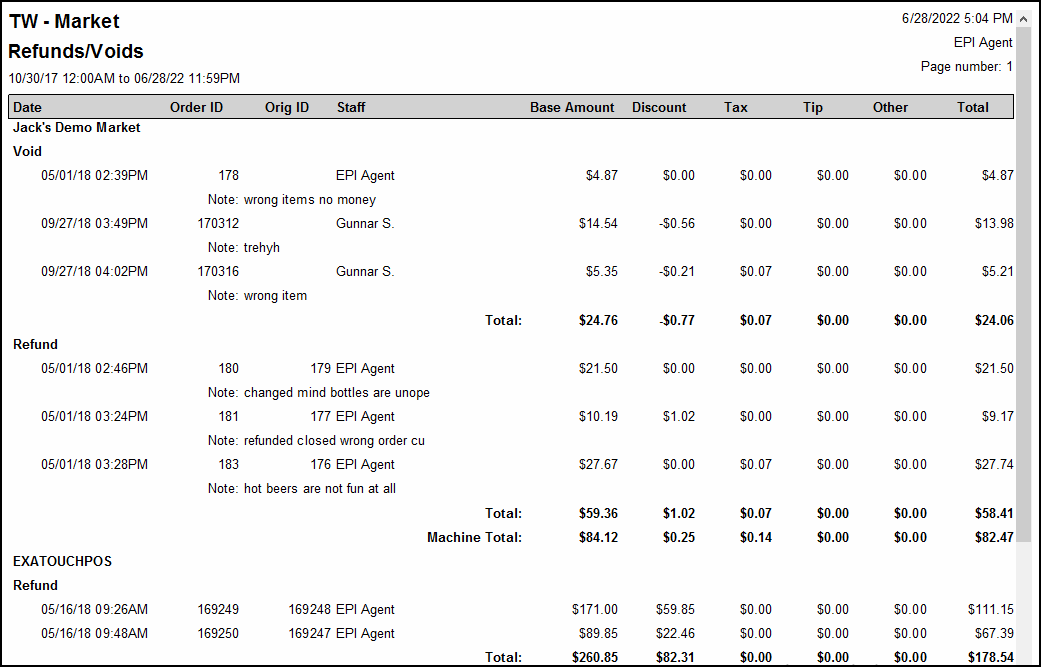
Refund/Void reports track orders that were refunded or voided. Voided payments display the original ID for the payment recorded in the report. Refunded payments record the original Order ID as well as the new Order ID created from processing the refund.
- Date – Date and time transaction was processed.
- Order ID – Order number of the transaction. For voids, the original Order ID displays. For refunds, a new Order ID is created. The refund reason displays as well.
- Orig ID – Original Order number of the sale. Voids do not display, but refunds may display multiple times if more than one refund is performed.
- Staff – Staff member who processed the refund or void.
- Base Amount – Amount pre-discount, tax, tip, and other fees.
- Discount – Discount total from the order.
- Tax – Tax value that is being refunded or voided.
- Tip – Tips that are refunded or voided.
- Other – Any other charge not part of prior fields. Examples include admin and delivery fees.
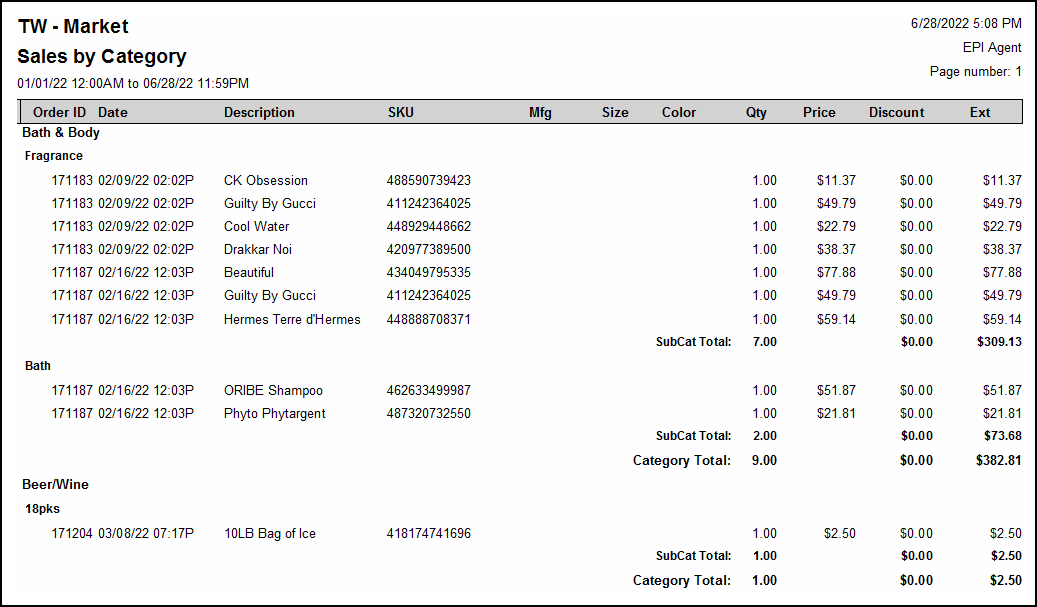
The Sales by Category reports group sales data by Category and Subcategory.
- Order ID – Order ID is assigned every time an item is sold or refunded.
- If Auto Group Item is enabled, items display together.
- If Auto Group Items is disabled, items display as separate records.
- Date – Displays date and time of the transaction.
- Description – Name of the item.
- SKU – The SKU number saved for an item.
- Mfg – The manufacturer of the saved item. This can be useful for Scan Data merchants.
- Size – Size of the item. This is not the Pack Size from the Pricing tab.
- Color – Color of the saved item.
- Qty – Quantity of the sold item.
- If Auto Group Items is enabled, like items display in the same record.
- If Auto Group Items is disabled, items display as separate records.
- For refunds, the record displays as a negative number.
- For weighted items, records display as price per unit. This value is sometimes negative when refunds are made.
- Price – The price before applying any discounts, fees, or taxes. For weighted items, the price is per unit. The value sometimes is negative, indicating a refund was made.
- Discount – All manual and automatic discounts applied to items, excluding tender type discounts. Discounts always display as a negative value.
- Ext – Displays the price excluding discounts for records on the report. For refunds, this value is sometimes negative.
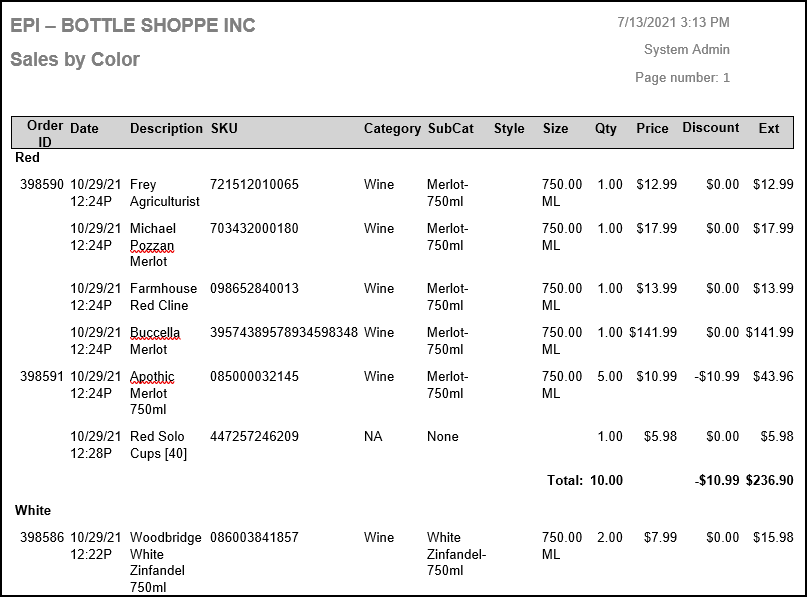
Sales by Color reports displays item sales data by item color.
- Order ID – Order number of the transaction.
- If Auto Group Item is enabled, items display together.
- If Auto Group Items is disabled, items display as separate records.
- Date – Date and time of the sale.
- Description – Description of the item.
- SKU – Primary SKU (saved on Items Details page).
- Mfg – Manufacturer name (from Items Details). This can be useful for Scan Data merchants.
- Size – Size of the item. This is not the Pack Size from the Pricing tab.
- Color – Color of the saved item.
- Qty – Quantity of the sold item.
- If Auto Group Items is enabled, like items display in the same record.
- If Auto Group Items is disabled, items display as separate records.
- For refunds, the record displays as a negative number.
- For weighted items, records display as price per unit. This value is sometimes negative when refunds are made.
- Price – Price before applying any discounts, fees, or taxes. For weighted items, the price is per unit. The value sometimes is negative, indicating a refund was made.
- Discount – Discounts applied to items, excluding tender type discounts. Discounts always display as a negative value.
- Ext – Displays the price excluding discounts for records on the report. For refunds, this value is sometimes negative.
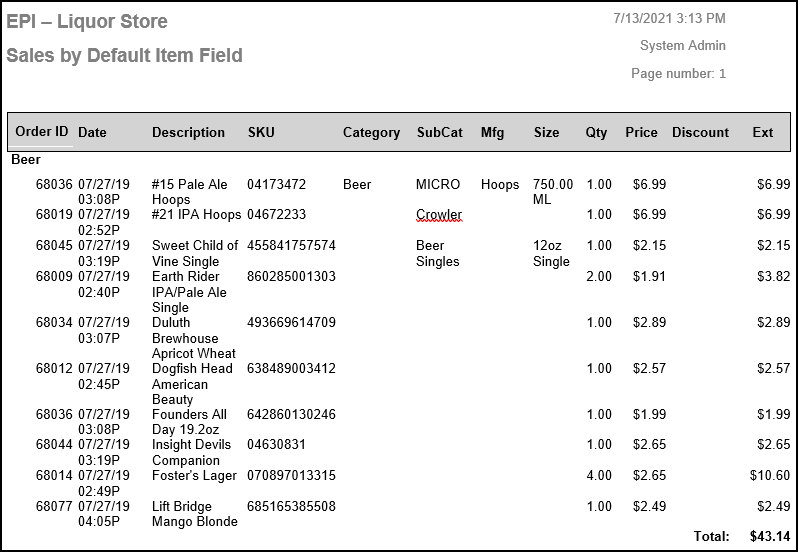
Custom Field reports organize item sales into one of three user-created custom fields. Custom field options are selected on the Item Details page under the Inventory tab.
- Order ID – Order number of the transaction.
- If Auto Group Item is enabled, items display together.
- If Auto Group Items is disabled, items display as separate records.
- Date – Date and time of the sale.
- Description – Description of the item.
- SKU – Primary SKU (saved on Items Details page).
- Category – Category of item sold. If selected on a Misc Sale, it will display here.
- Subcategory of item sold. If selected on a Misc Sale, it will display here.
- Mfg – Manufacturer name (from Items Details). This can be useful for Scan Data merchants.
- Size – Size of the item. This is not the Pack Size from the Pricing tab.
- Color – Color of the saved item.
- Qty – Quantity of the sold item.
- If Auto Group Items is enabled, like items display in the same record.
- If Auto Group Items is disabled, items display as separate records.
- For refunds, the record displays as a negative number.
- For weighted items, records display as price per unit. This value is sometimes negative when refunds are made.
- Price – Price before applying any discounts, fees, or taxes. For weighted items, the price is per unit. The value sometimes is negative, indicating a refund was made.
- Discount – Discounts applied to items, excluding tender type discounts. Discounts always display as a negative value.
- Ext – Displays the price excluding discounts for records on the report. For refunds, this value is sometimes negative.
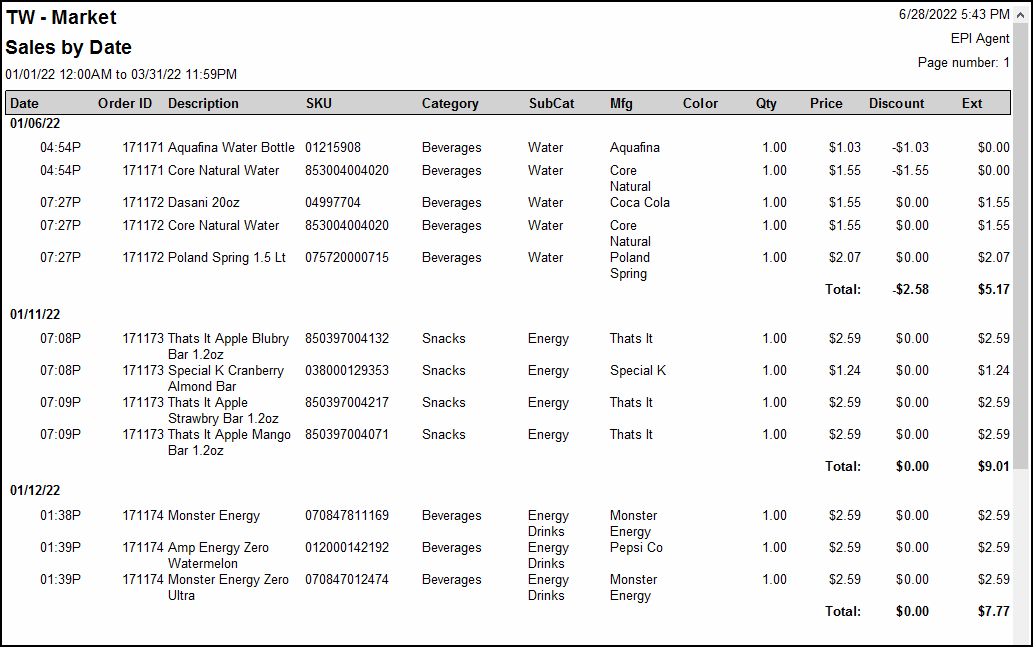
Sales by Date reports display items sales according to when they were sold. Reports are grouped by calendar date.
-
- Date – Date and time of the sale.
- Order ID – Order number of the sale.
- If Auto Group Item is enabled, items display together.
- If Auto Group Items is disabled, items display as separate records.
- Description – Description of the item.
- SKU – Primary SKU (saved on Items Details page).
- Category – Category of item sold. If selected on a Misc Sale, it will display here.
- Subcategory of item sold. If selected on a Misc Sale, it will display here.
- Mfg – Manufacturer name (from Items Details). This can be useful for Scan Data merchants.
- Size – Size of the item. This is not the Pack Size from the Pricing tab.
- Color – Color of the saved item.
- Qty – Quantity of the sold item.
- If Auto Group Items is enabled, like items display in the same record.
- If Auto Group Items is disabled, items display as separate records.
- For refunds, the record displays as a negative number.
- For weighted items, records display as price per unit. This value is sometimes negative when refunds are made.
- Price – Price before applying any discounts, fees, or taxes. For weighted items, the price is per unit. The value sometimes is negative, indicating a refund was made.
- Discount – Discounts applied to items, excluding tender type discounts. Discounts always display as a negative value.
- Ext – Displays the price excluding discounts for records on the report. For refunds, this value is sometimes negative.
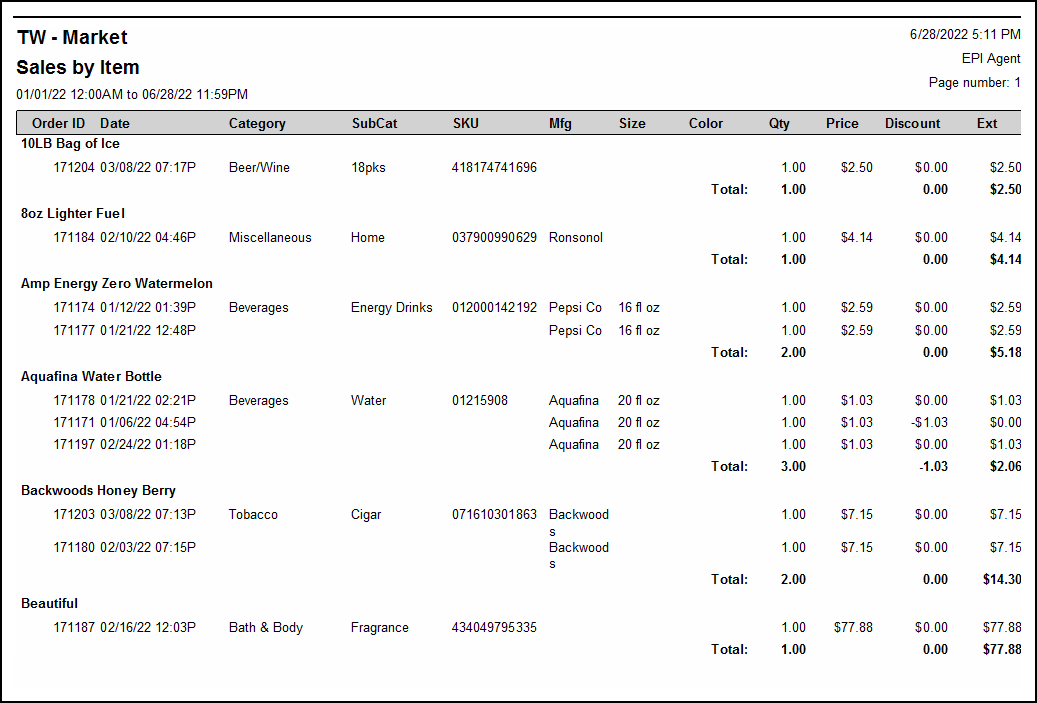
The Sales by Item reports display all items sold or refunded for a given period.
-
-
- Order ID – Order number of the sale.
- If Auto Group Item is enabled, items display together.
- If Auto Group Items is disabled, items display as separate records.
- Date – Date and time of the sale.
- Category – Category of item sold. If selected on a Misc Sale, it will display here.
- Subcategory of item sold. If selected on a Misc Sale, it will display here.
- SKU – Primary SKU (saved on Items Details page).
- Mfg – Manufacturer name (from Items Details). This can be useful for Scan Data merchants.
- Size – Size of the item. This is not the Pack Size from the Pricing tab.
- Color – Color of the saved item.
- Qty – Quantity of the sold item.
- If Auto Group Items is enabled, like items display in the same record.
- If Auto Group Items is disabled, items display as separate records.
- For refunds, the record displays as a negative number.
- For weighted items, records display as price per unit. This value is sometimes negative when refunds are made.
- Price – Price before applying any discounts, fees, or taxes. For weighted items, the price is per unit. The value sometimes is negative, indicating a refund was made.
- Discount – Discounts applied to items, excluding tender type discounts. Discounts always display as a negative value.
- Ext – Displays the price excluding discounts for records on the report. For refunds, this value is sometimes negative.
- Order ID – Order number of the sale.
-
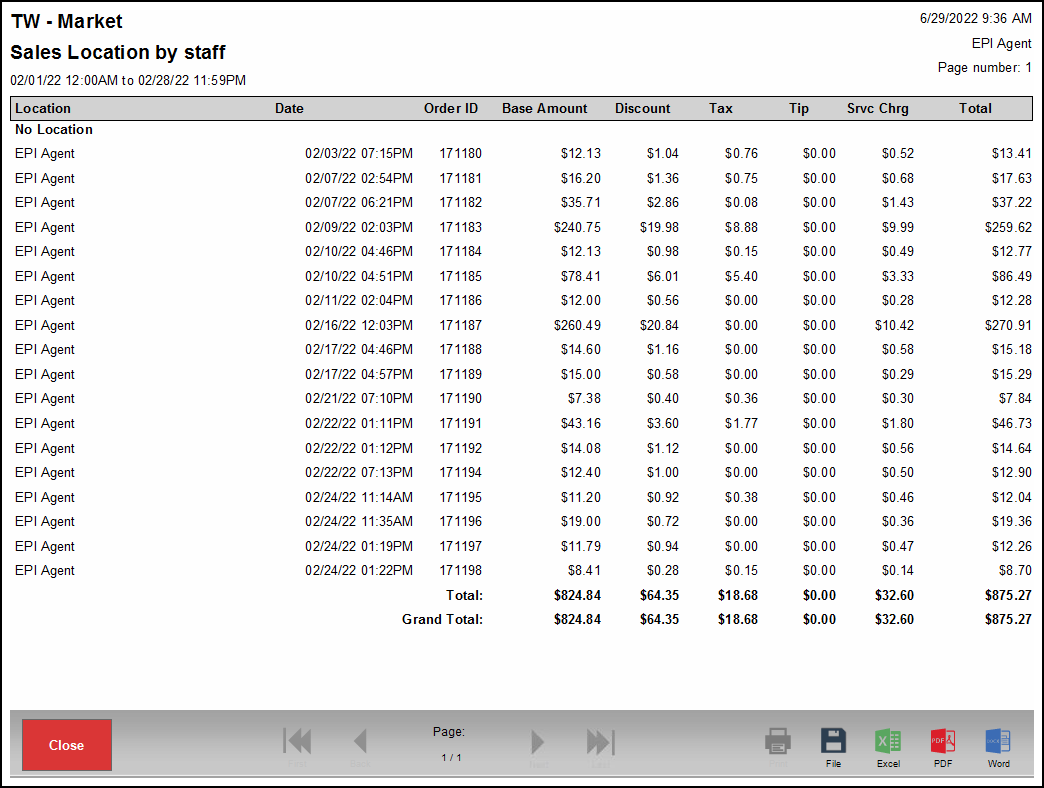
Sales Location by Staff reports provide merchants with sales data organized by Floor Plan names. For example, a commonly used table may have many sales records associated with it.
Each table has totals for the Base Amount, Tax, Tip, Srvc Chrg, and Total columns. A grand total sums up all columns at the end of the report.
-
-
- Location – Label on the floor plan table where the order was placed.
- Date – Date and time of the transaction.
- Order ID – Order number of the sale.
- If Auto Group Items is enabled, items display together.
- If Auto Group Items is disabled, items display as separate records.
- Base Amount – Cost, excluding discounts, taxes, tips, and other fees.
- Discount – Discount total from the order.
- Tax – Total tax from the order.
- Tip – Tip accepted on the order.
- Srvc Chrg – Admin fee (set up in account settings).
- Total – Sum of base amount, discount, tax, and service charge.
-
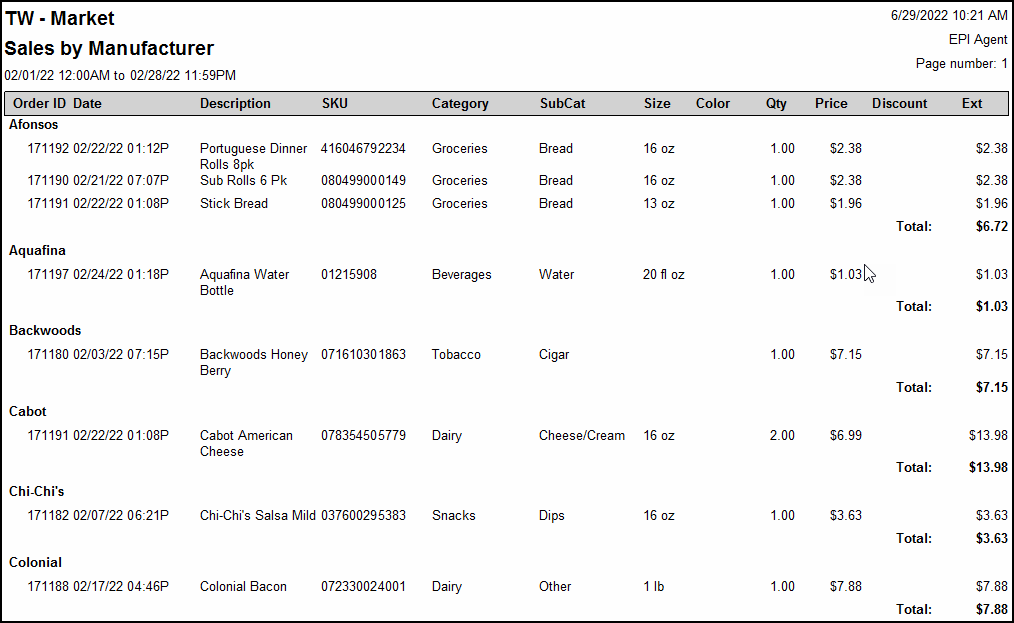
Sales by Manufacturer reports provide merchants with items sales data organized by the manufacturer. Each item has totals for the Qty and Ext columns. The sum of all items in the Ext column display in the Grand Total at the end of the report. Refund by Item creates records on this report.
-
-
- Order ID – Order number of the sale.
- If Auto Group Item is enabled, items display together.
- If Auto Group Items is disabled, items display as separate records.
- Date – Date and time of the sale.
- Description – Description of the item.
- SKU – Primary SKU (saved on Items Details page).
- Category – Category of item sold. If selected on a Misc Sale, it will display here.
- SubCat – Subcategory of item sold. If selected on a Misc Sale, it will display here.
- Size – Size of the item. This is not the Pack Size from the Pricing tab.
- Color – Color of the saved item.
- Qty – Quantity of the sold item.
- If Auto Group Items is enabled, like items display in the same record.
- If Auto Group Items is disabled, items display as separate records.
- For refunds, the record displays as a negative number.
- For weighted items, records display as price per unit. This value is sometimes negative when refunds are made.
- Price – Price before applying any discounts, fees, or taxes. For weighted items, the price is per unit. The value sometimes is negative, indicating a refund was made.
- Discount – Discounts applied to items, excluding tender type discounts. Discounts always display as a negative value.
- Ext – Displays the price excluding discounts for records on the report. For refunds, this value is sometimes negative.
- Order ID – Order number of the sale.
-
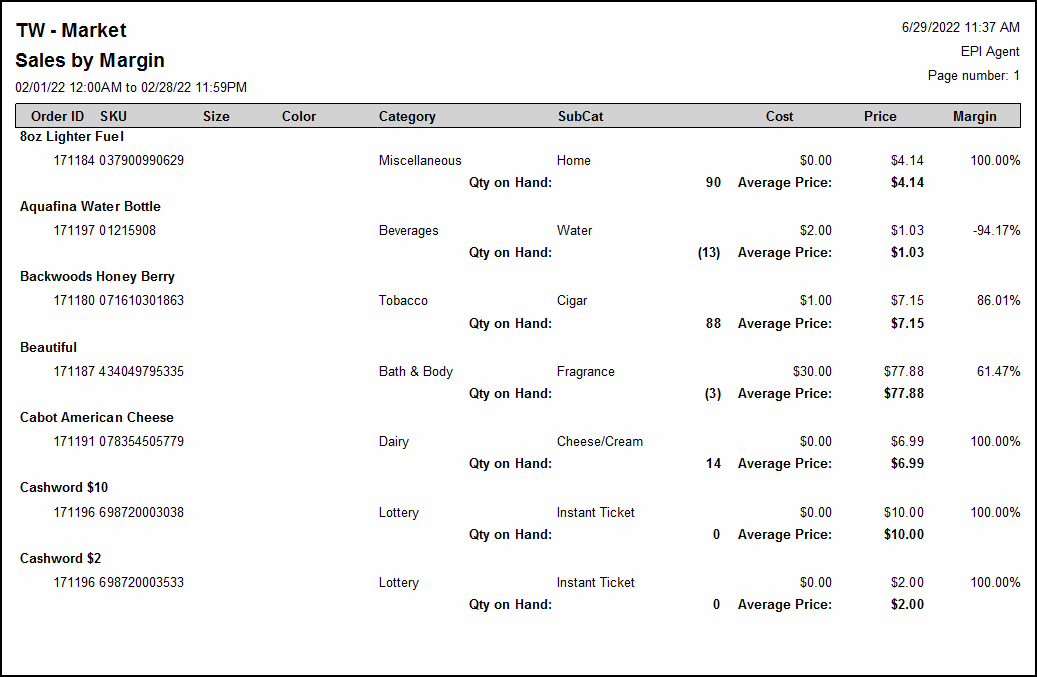
Sales by Margin reports provide merchants with their profit margins per item sold. Reports are grouped together by item. Popular items may have many records displaying underneath.
Items without a cost entered display with a margin of 100%. Misc. Sale, Open Item Taxable, and Open Item Non-Taxable reports display under Miscellaneous Item. The quantity on hand displays per item. Quantities displaying in parentheses are negative numbers.
-
-
- Order ID – Order number of the sale.
- If Auto Group Item is enabled, items display together.
- If Auto Group Items is disabled, items display as separate records.
- SKU – Primary SKU (saved on Items Details page).
- Size – Size of the item. This is not the Pack Size from the Pricing tab.
- Color – Color of the saved item.
- Category – Category of item sold. If selected on a Misc Sale, it will display here.
- SubCat – Subcategory of item sold. If selected on a Misc Sale, it will display here.
- Size – Size of the item. This is not the Pack Size from the Pricing tab.
- Cost – Default item cost at time of sale.
- Price – Price before applying any discounts, fees, or taxes. For weighted items, the price is per unit. The value sometimes is negative, indicating a refund was made.
- Margin – Margin calculated per sale.
- Order ID – Order number of the sale.
-
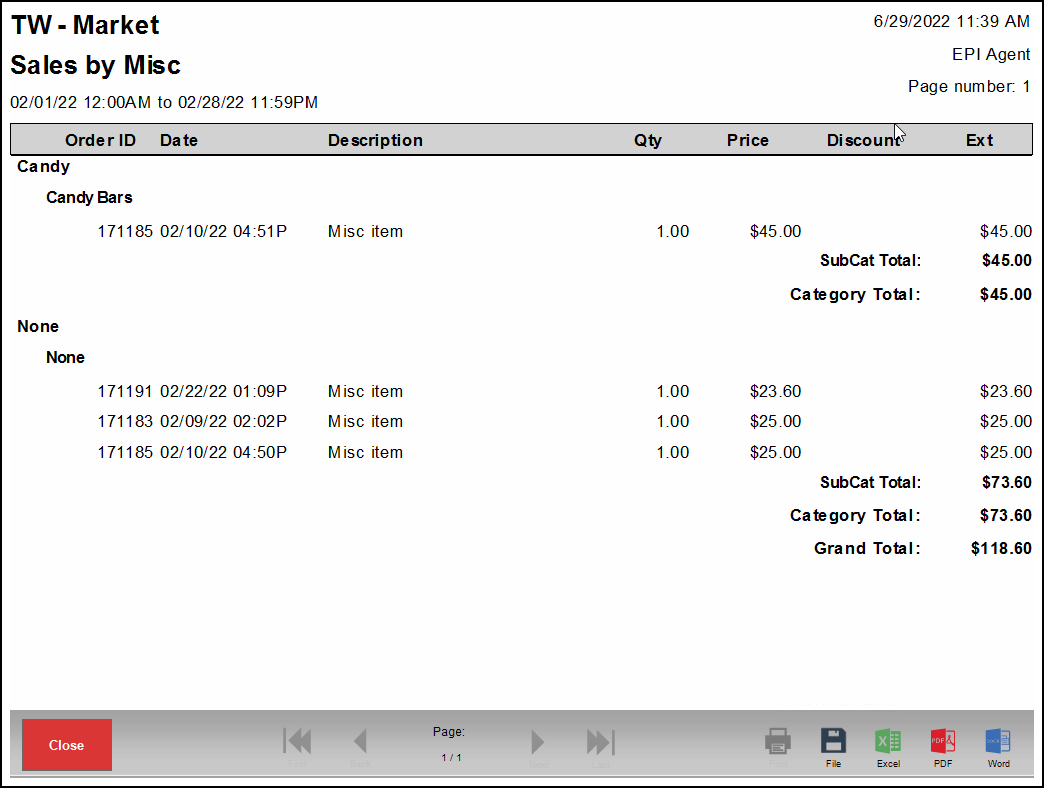
The Miscellaneous Sales report provides sales data from Open Item Taxable and Non-taxable, as well as Misc Items.
-
-
- Order ID – Order number of the sale.
- If Auto Group Item is enabled, items display together.
- If Auto Group Items is disabled, items display as separate records.
- Date – Date and time of the transaction.
- Description – Name of the item.
- Qty – Quantity of the sold item.
- If Auto Group Items is enabled, like items display in the same record.
- If Auto Group Items is disabled, items display as separate records.
- For refunds, the record displays as a negative number.
- For weighted items, records display as price per unit. This value is sometimes negative when refunds are made.
- Price – Price before applying any discounts, fees, or taxes. For weighted items, the price is per unit. The value sometimes is negative, indicating a refund was made.
- Discount – Discounts applied to items, excluding tender type discounts. Discounts always display as a negative value.
- Ext – Displays the price excluding discounts for records on the report. For refunds, this value is sometimes negative.
- Order ID – Order number of the sale.
-
Service sales reports display all services sold or refunded for a given period. Reports are grouped by service. For example, a popular service like a men’s hair cut may have multiple sales records associated with it.
Each service has totals for the Qty and Ext columns. The sum of all items in the Ext column display in the Grand Total at the end of the report.
-
-
- Order ID – Order number of the sale.
- If Auto Group Item is enabled, items display together.
- If Auto Group Items is disabled, items display as separate records.
- Date – Date and time of the sale.
- Staff – Staff member to whom the service was assigned, not the employee who checked out the order.
- Category – Category of item sold. If selected on a Misc Sale, it will display here.
- SubCat – Subcategory of item sold. If selected on a Misc Sale, it will display here.
- Qty – Quantity of the sold item.
- If Auto Group Items is enabled, like items display in the same record.
- If Auto Group Items is disabled, items display as separate records.
- For refunds, the record displays as a negative number.
- For weighted items, records display as price per unit. This value is sometimes negative when refunds are made.
- Price – Price before applying any discounts, fees, or taxes. The value sometimes is negative, indicating a refund was made.
- Discount – Discounts applied to items, excluding tender type discounts. Discounts always display as a negative value.
- Ext – Displays the price excluding discounts for records on the report. For refunds, this value is sometimes negative.
- Order ID – Order number of the sale.
-
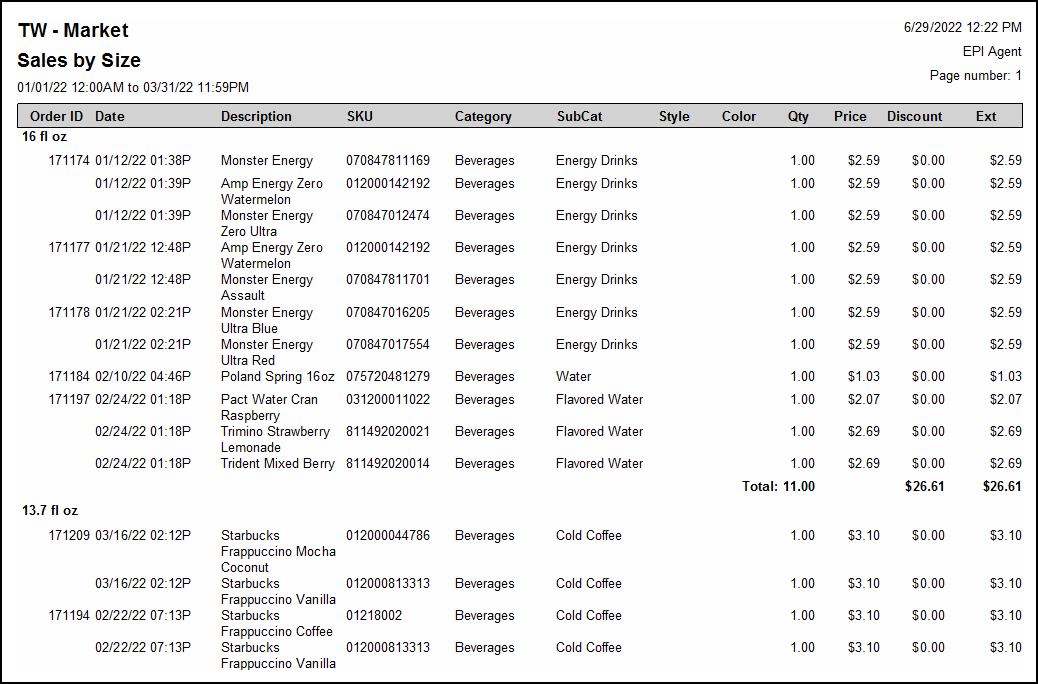
Sales by Size reports provide merchants with sales data by item size. Refund by Item creates records for this report.
-
-
- Order ID – Order number of the sale.
- If Auto Group Item is enabled, items display together.
- If Auto Group Items is disabled, items display as separate records.
- Date – Date and time of the sale.
- Description – Description of the item.
- SKU – Primary SKU (saved on Items Details page).
- Category – Category of item sold. If selected on a Misc Sale, it will display here.
- SubCat – Subcategory of item sold. If selected on a Misc Sale, it will display here.
- Style – Item style.
- Color – Color of the saved item.
- Qty – Quantity of the sold item.
- If Auto Group Items is enabled, like items display in the same record.
- If Auto Group Items is disabled, items display as separate records.
- For refunds, the record displays as a negative number.
- For weighted items, records display as price per unit. This value is sometimes negative when refunds are made.
- Price – Price before applying any discounts, fees, or taxes. For weighted items, the price is per unit. The value sometimes is negative, indicating a refund was made.
- Discount – Discounts applied to items, excluding tender type discounts. Discounts always display as a negative value.
- Ext – Displays the price excluding discounts for records on the report. For refunds, this value is sometimes negative.
- Order ID – Order number of the sale.
-
-
-
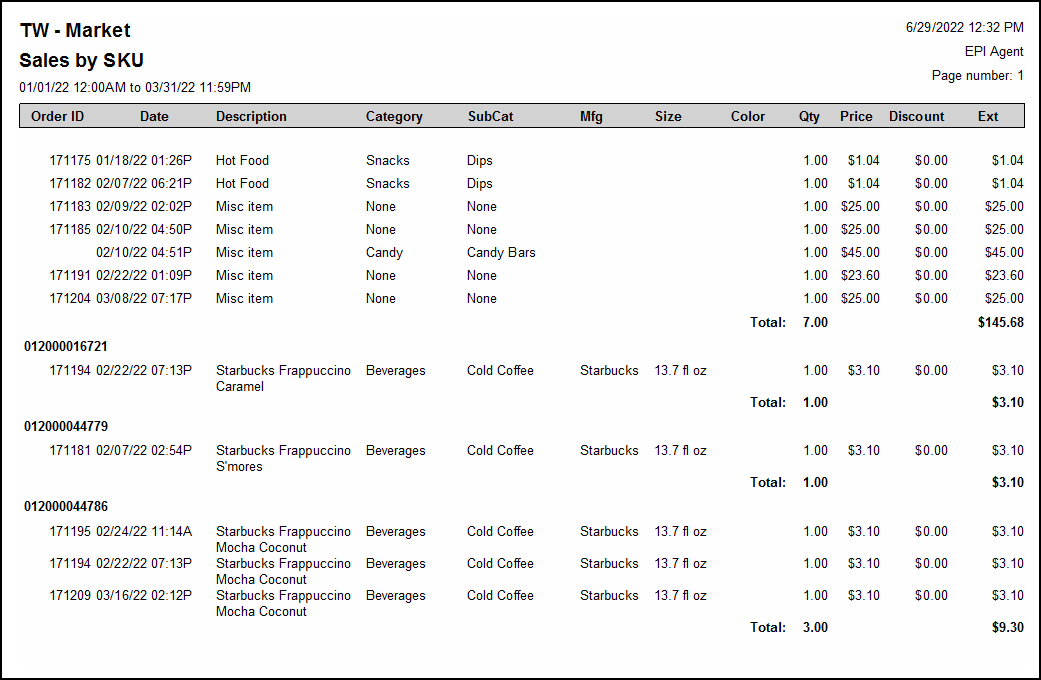
- Order ID – Order number of the sale.
- If Auto Group Item is enabled, items display together.
- If Auto Group Items is disabled, items display as separate records.
- Date – Date and time of the sale.
- Description – Description of the item.
- Category – Category of item sold. If selected on a Misc Sale, it will display here.
- SubCat – Subcategory of item sold. If selected on a Misc Sale, it will display here.
- Mfg – Name of item manufacturer.
- Size – Size of the item. This is not the Pack Size from the Pricing tab.
- Color – Color of the saved item.
- Qty – Quantity of the sold item.
- If Auto Group Items is enabled, like items display in the same record.
- If Auto Group Items is disabled, items display as separate records.
- For refunds, the record displays as a negative number.
- For weighted items, records display as price per unit. This value is sometimes negative when refunds are made.
- Price – Price before applying any discounts, fees, or taxes. For weighted items, the price is per unit. The value sometimes is negative, indicating a refund was made.
- Discount – Discounts applied to items, excluding tender type discounts. Discounts always display as a negative value.
- Ext – Displays the price excluding discounts for records on the report. For refunds, this value is sometimes negative.
- Order ID – Order number of the sale.
-
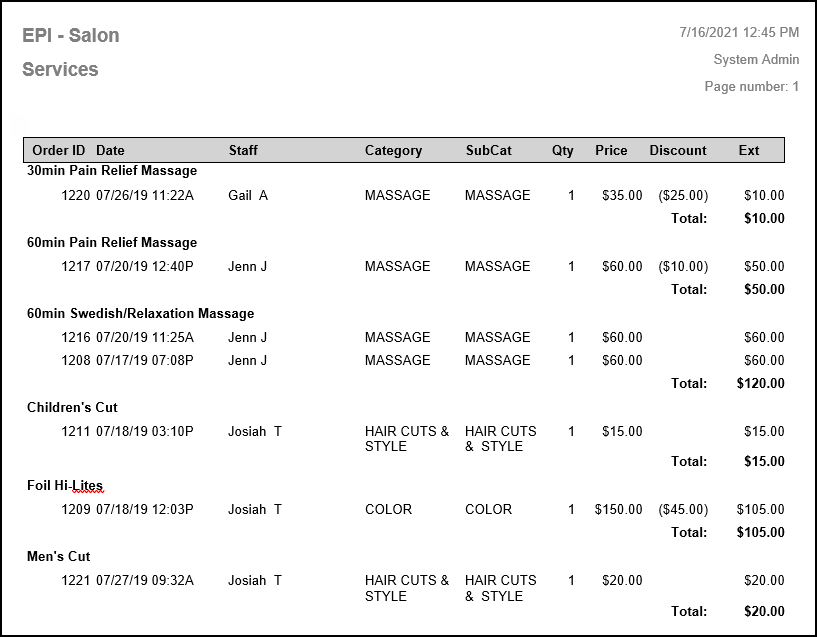
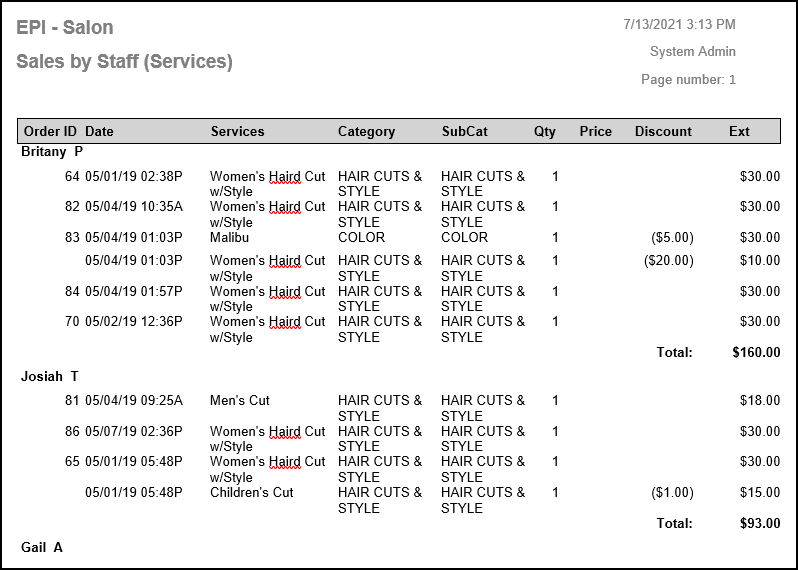
A report designed for businesses primarily focused more on services than physical items. This report contains transactional data on services sold. A summary version of this report is available.
-
-
- Order ID – Order ID is assigned every time an item is sold or refunded.
- If Auto Group Item is enabled, items display together.
- If Auto Group Items is disabled, items display as separate records.
- Date – Date and time of the transaction.
- Services – The services that an employee performed.
- Category – Displays the Category in which the service was sold.
- SubCat – Displays the Subcategory in which the service was sold.
- Qty – Quantity of the sold item.
- If Auto Group Items is enabled, like items display in the same record.
- If Auto Group Items is disabled, items display as separate records.
- For refunds, the record displays as a negative number.
- For weighted items, records display as price per unit. This value is sometimes negative when refunds are made.
- Price – The price before applying any discounts, fees, or taxes. The value sometimes is negative, indicating a refund was made.
- Discount – All manual and automatic discounts applied to items, excluding tender type discounts. Discounts always display as a negative value.
- Ext – Displays the price excluding discounts for records on the report. For refunds, this value is sometimes negative.
- Order ID – Order ID is assigned every time an item is sold or refunded.
-
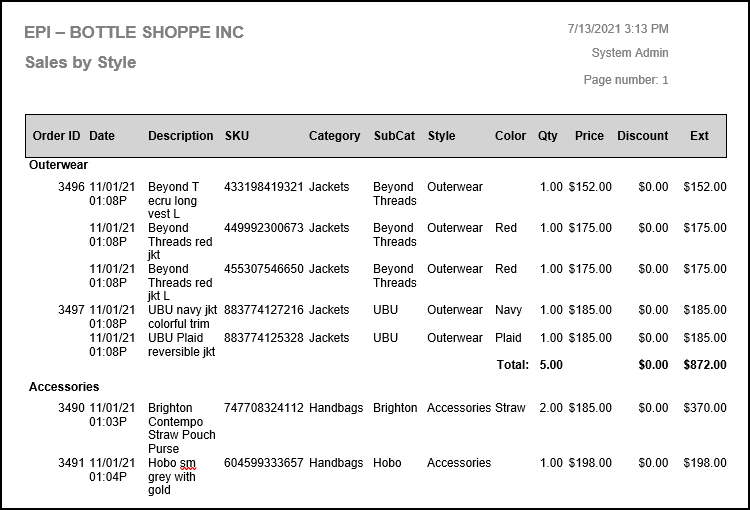
Sales by Style reports provide merchants with item sales data by item style.
-
-
- Order ID – Order number of the sale.
- If Auto Group Item is enabled, items display together.
- If Auto Group Items is disabled, items display as separate records.
- Date – Date and time of the sale.
- Description – Description of the item.
- SKU – Primary SKU (saved on Items Details page).
- Category – Category of item sold. If selected on a Misc Sale, it will display here.
- SubCat – Subcategory of item sold. If selected on a Misc Sale, it will display here.
- Style – Item style.
- Color – Color of the saved item.
- Qty – Quantity of the sold item.
- If Auto Group Items is enabled, like items display in the same record.
- If Auto Group Items is disabled, items display as separate records.
- For refunds, the record displays as a negative number.
- For weighted items, records display as price per unit. This value is sometimes negative when refunds are made.
- Price – Price before applying any discounts, fees, or taxes. For weighted items, the price is per unit. The value sometimes is negative, indicating a refund was made.
- Discount – Discounts applied to items, excluding tender type discounts. Discounts always display as a negative value.
- Ext – Displays the price excluding discounts for records on the report. For refunds, this value is sometimes negative.
- Order ID – Order number of the sale.
-
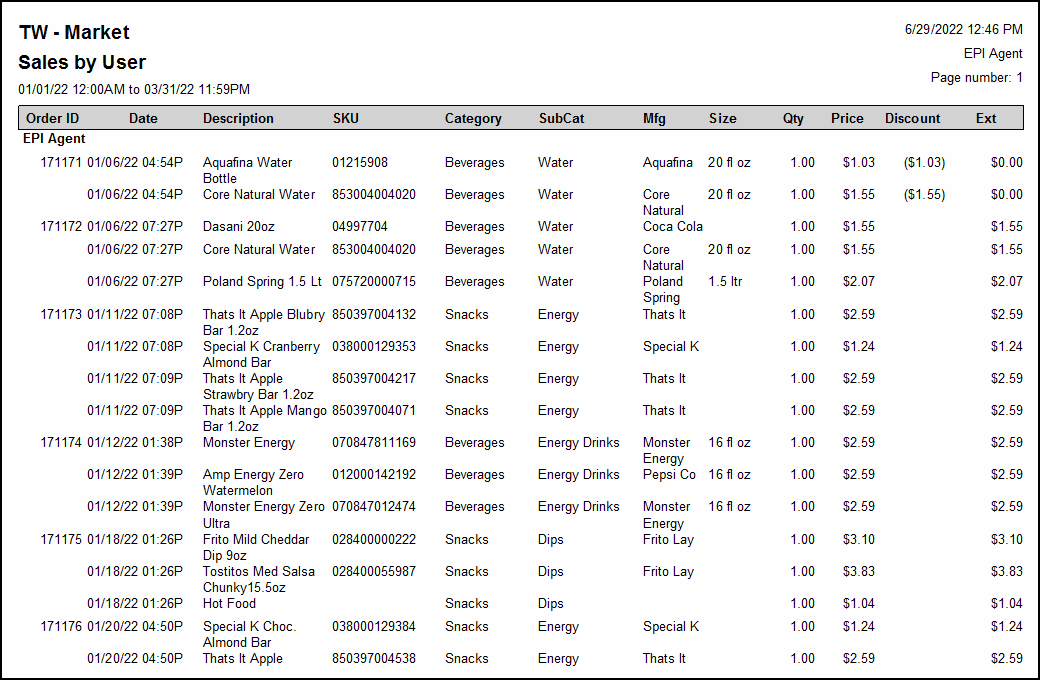
Sales by User reports provide merchants with items sales organized by the employee who sold them.
-
-
- Order ID – Order ID from a sale or refund.
- If Auto Group Item is enabled, items display together.
- If Auto Group Items is disabled, items display as separate records.
- Date – Date and time of the sale.
- Description – Description of the item.
- SKU – Primary SKU of the item.
- Category – Category of item sold. If selected on a Misc Sale, it will display here.
- SubCat – Subcategory of item sold. If selected on a Misc Sale, it will display here.
- Mfg – Name of item manufacturer.
- Size – Size of the item. This is not the Pack Size from the Pricing tab.
- Qty – Quantity of the sold item.
- If Auto Group Items is enabled, like items display in the same record.
- If Auto Group Items is disabled, items display as separate records.
- For refunds, the record displays as a negative number.
- For weighted items, records display as price per unit. This value is sometimes negative when refunds are made.
- Price – Price before applying any discounts, fees, or taxes. For weighted items, the price is per unit. The value sometimes is negative, indicating a refund was made.
- Discount – Discounts applied to items, excluding tender type discounts. Discounts always display as a negative value.
- Ext – Displays the price excluding discounts for records on the report. For refunds, this value is sometimes negative.
- Order ID – Order ID from a sale or refund.
-
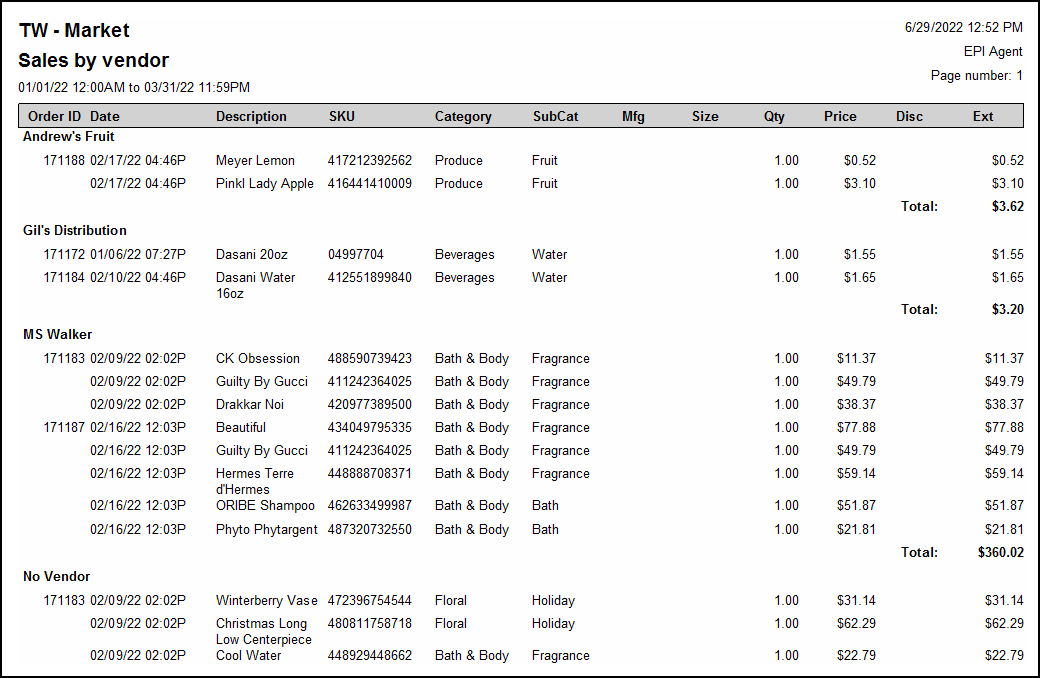
Sales by Vendor reports provide merchants with item sales organized by vendor.
-
-
- Order ID – Order ID from a sale or refund.
- If Auto Group Item is enabled, items display together.
- If Auto Group Items is disabled, items display as separate records.
- Date – Date and time of the sale.
- Description – Description of the item.
- SKU – Primary SKU of the item.
- Category – Category of item sold. If selected on a Misc Sale, it will display here.
- SubCat – Subcategory of item sold. If selected on a Misc Sale, it will display here.
- Mfg – Name of item manufacturer.
- Size – Size of the item. This is not the Pack Size from the Pricing tab.
- Qty – Quantity of the sold item.
- If Auto Group Items is enabled, like items display in the same record.
- If Auto Group Items is disabled, items display as separate records.
- For refunds, the record displays as a negative number.
- For weighted items, records display as price per unit. This value is sometimes negative when refunds are made.
- Price – Price before applying any discounts, fees, or taxes. For weighted items, the price is per unit. The value sometimes is negative, indicating a refund was made.
- Discount – Discounts applied to items, excluding tender type discounts. Discounts always display as a negative value.
- Ext – Displays the price excluding discounts for records on the report. For refunds, this value is sometimes negative.
- Order ID – Order ID from a sale or refund.
-
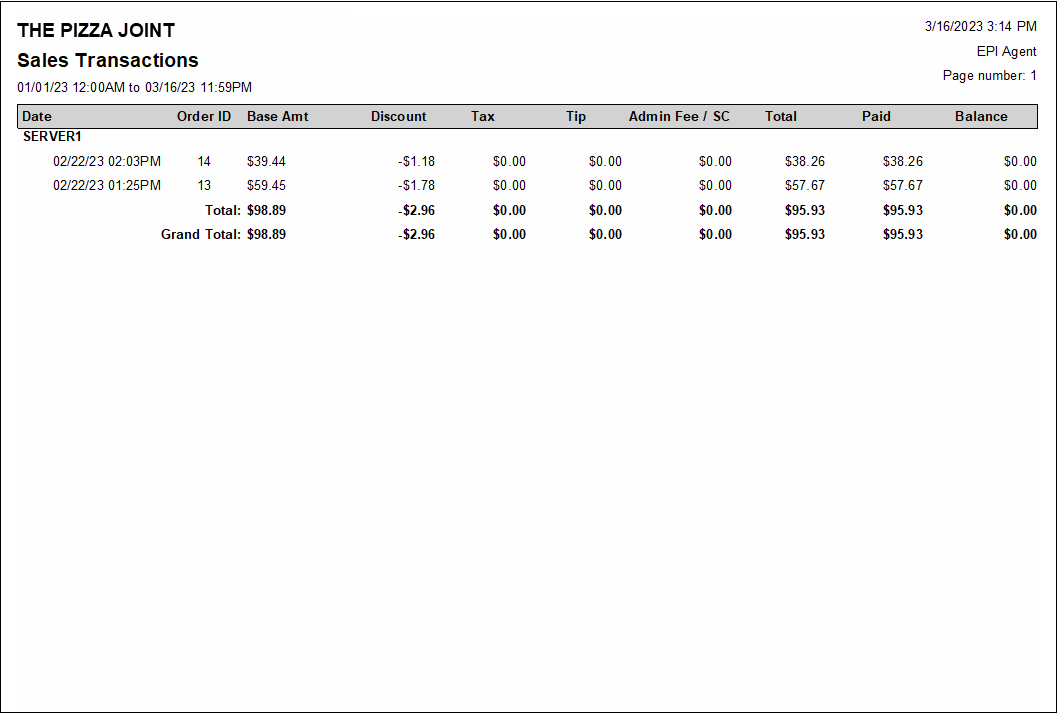
Sales Transactions reports provide sales data based on customer records added during sales.
-
-
- Date – Date and time of the sale.
- Order ID – Order ID from sale/transaction/order.
- Base Amt – Amount pre-discount, tax, tip, and other fees.
- Discount – Discounts applied to items, excluding tender type discounts. Discounts always display as a negative value.
- Tax – Tax total from the order.
- Tip – Tips accepted on the order (if applicable).
- Admin Fee – Admin fee (set in the account settings).
- Total – Sum of base amount, discount, tax, and service charge.
- Paid – Portion of the order paid for. This will be less than the Total if the order is partially paid for.
- Balance – Portion of the order left over. This will be zero unless there is a remaining balance on the order.
-
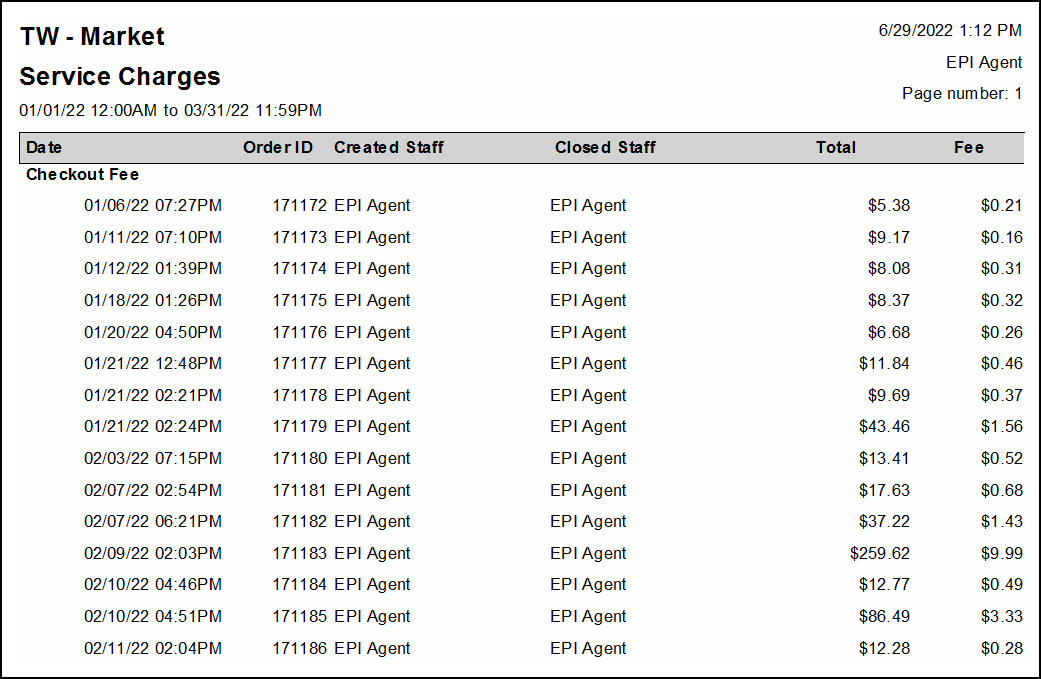
Service Charges reports provide merchants with a breakdown of service fees charged. Service charges that can display on this report include Admin Fees, Delivery Fees, and other manually applied fees.
-
-
- Date – Date and time order was closed.
- Order ID – Order ID created for sale/transaction/order.
- Created Staff – Staff member who opened the order.
- Closed Staff – Staff member who completed the order.
- Total – Sum of all items, taxes, and fees.
- Fee – Fees charged on order.
-
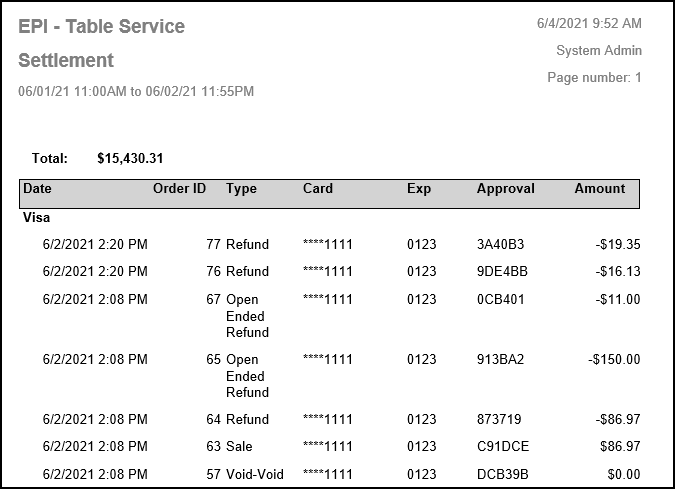
Settlement reports track authorizations. Any auths that occur are tracked regardless of Order ID. Split payments and refunds receive their own line.
Reports organize by card type, such as Visa, MasterCard, or American Express. All refunds (but not voids) display under their respective card type. They display with the auth code and with a negative amount. Refunds receive their own Order ID.
-
-
- Date – Date and time of the transaction/order.
- Order ID – The order ID of the transaction/order.
- Type – The transaction type, such as Refund, Open Ended Refund, Sale, or Void.
- Card – The card number of the transaction. Only the last four digits of the card display.
- Exp – Expiration date of the card used for an order.
- Approval – Approval code for the card used for an order.
- Amount – Amount of the transaction/order.
-
The following displays how settlements are reported based on payment type:
Credit
Retail:
- Displays amount run. The Type displays as Sale.
Restaurant:
- Pre-tip shows amount run and Type as Auth.
- Post-tip updates the record to include tip amount. Type displays as Capture.
- Readjustment also updates the amount, but this time the Type displays as Adjustment.
If any credit sale is voided, the amount updates to $0 and the Type updates to Void-Void.
Settlement reports display manually entered credit cards as a normal credit sale. If run in offline mode, it reports the same as if online.
Tab Auth
Retail:
- Tab Auth unavailable.
Restaurant:
- Pre Tab Complete has no record in the report even though an auth is captured.
- Readjustments also update the amount, but this time the Type displays Adjustment.
If any Tab Auth is voided, the amount updates to $0 and the Type updates to Void-Void. If you don’t perform a Tab Complete, but accept a different payment option instead, it voids the Tab Auth. This feature is not available offline.
Debit
Retail
- Displays the amount run. Type displays as Sale. Debit cannot be adjusted.
Restaurant
- Debit unavailable.
EBT
Retail
- Displays the amount run. Type displays as Sale. EBT cannot be adjusted.
Restaurant
- EBT unavailable.
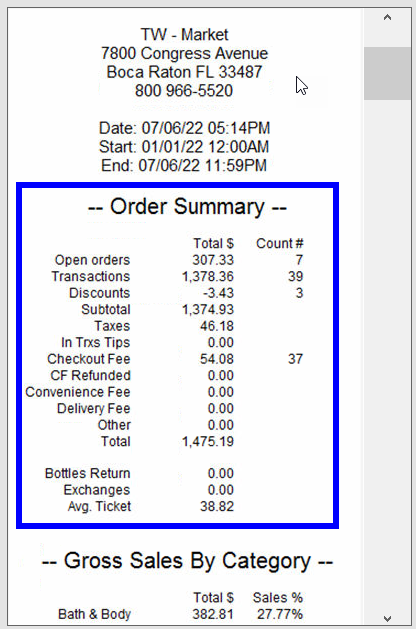
The Snapshot report provides a quick overview of your business data directly from the receipt printer, for this station only.
If you do not have transactional data in a section listed below, it may not appear on the report. Sections can be added and removed by navigating from Home to Settings > Print Settings > Snapshot.
Order Summary
- Open Orders – Sum of all open orders. These orders can be viewed from the Get Order button within the Register. The reported total reflects any discounts except those applied due to tender type. The reported total does not reflect partial payments.
- Transactions – Sum of all items and services sold where payment is collected in full. This is the item total before any discounts or taxes.
- Discounts – Total of all dollar- and percentage-based discounts applied to orders. This includes all line item-, whole order- and tender-based discounts.
- Subtotal – The difference between Transactions and Discounts.
- Taxes – The sum of all tax groups collected after exemptions and refunds. The tax section at the bottom of the report displays taxes collected and refunded per group.
- In Trxs Tips – Sum of all in-transaction tips, applied via Tip Adjustments, Staff Declared Cash Tips, Add/Mod Tips, Touch CFD, or the TableTurn pay at the table device.
- Admin Fee – Adds all tender based fees set in Account settings.
- Convenience Fee – Totals convenience fees generated through DeliverMe.
- Delivery Fee – Sum of all in house and third-party delivery fees collected.
- Other – Sum of other fees collected. This includes promo-based fees defined as a percentage or dollar-base, and is set up in the Items Promos menu. Also included are CRV/DRV fees that are typically used for bottle deposit collection in retail.
- Total – Total collected from all transaction activity. This is not gross sales as defined by GAAP, since it includes tips, admin fees, delivery fees, and other fees collected during the transaction.
- Exchanges – Value and amount of all exchanged items.
- Avg. Ticket – Average ticket amount based on count of “Transactions” and “Total” from Order Summary section.
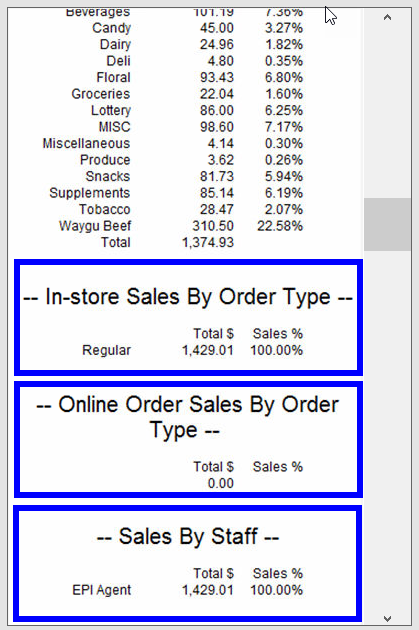
Sales By Category
Item total broken down by Category. This includes discounts applied, but not sales tax. It also excludes any tips or fees collected. The relative percentage reported is calculated against the sum of all categories.
In-Store Sales by Order Type
Displays sales by in-store order types in the register. This number is the sum of the Subtotal and Admin Fees applied. This total does not include tax.
Online Order Sales by Order Type
Online orders, such as DeliverMe sales. This number is the sum of subtotal and admin fees applied. This total does not include tax.
Sales by Staff
Sales broken down by staff member who has tendered the order. This total is a sum of subtotal, plus admin fees applied. This does not include tax.
Labor Tracking
- Labor Cost – Hourly wages of all employees. Staff must have an hourly rate set and use the clock in/clock out features.
- Net Sales – Subtotal from Order Summary. Percentage displays how much of the Subtotal goes toward hourly wages.
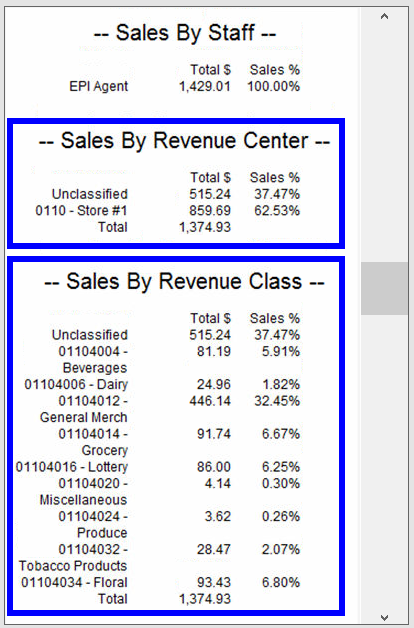
Sales by Revenue Center
Total of items broken down by defined value for Revenue Center definition found on Item’s Details. This number includes discounts applied. If there is no Center defined, values will report as unclassified.
Sales by Revenue Class
Total of items broken down by defined value for Revenue Class definition found on Item’s Details. This number includes discounts applied. If there is no Class defined, values will report as unclassified.
Net Sales By Day Part
Item totals broken down by user created time boxes throughout the day. Reported figures include discounts. Day Parts are defined within the Snapshot tab under Print Settings. They are optional, and report along with the cumulative total.
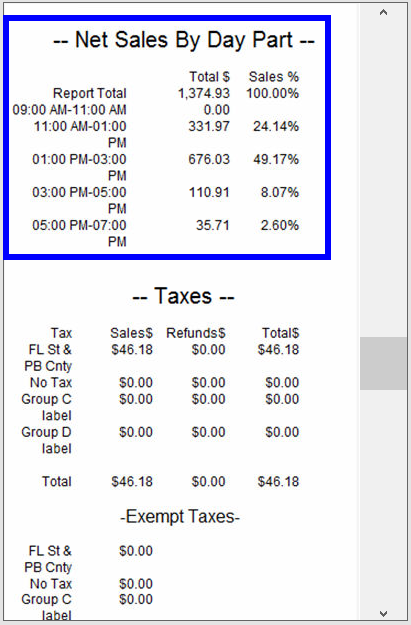
Taxes
- Sales – Taxes collected. The taxable amount used to derive total tax collected can be found on the Taxes report, and includes discounts applied to items. Depending on settings, it may also reflect service fees applied to orders.
- Refunds – Taxes refunded. The taxable amount used to derive total tax refunded can be found on the Taxes report, and includes discounts applied to items.
- Total – Difference between sales and refunded taxes collected for each group.
- Exempt – Any taxes exempt on an order. Based on payment method or customer status exemption.
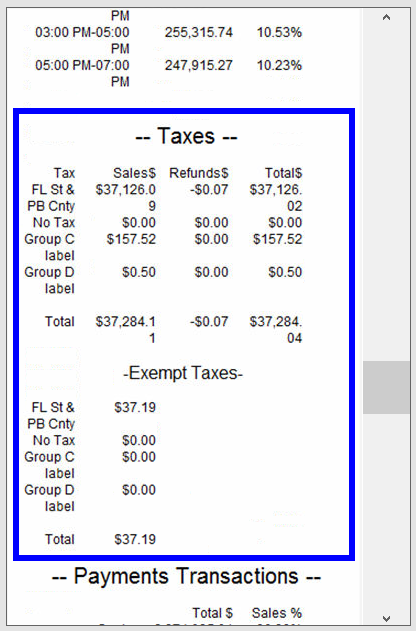
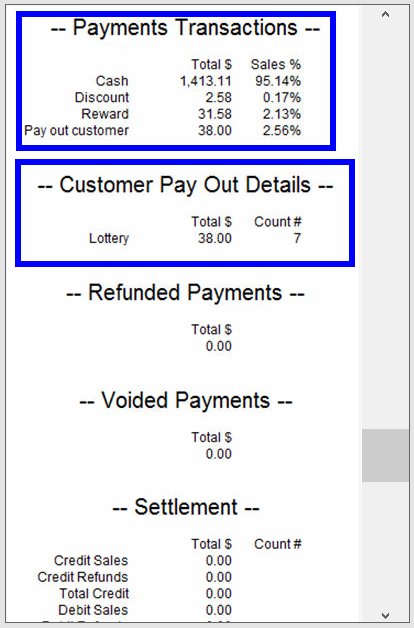
Payment Transactions
Reporting of all tenders collected. The reported numbers for each tender are based on total collected, inclusive of any discounts, tax, tips, and fees applied before or after tendering payment.
Customer Pay Out Details
Pay Outs issued for customers such as bottle returns or lottery payouts. Each Pay Out type used reports on its own line. Pay Out Customer reasons can be created under Preferences on the Custom Vars page.
Company Pay Out Details
Pay Outs issued for the merchant such as supplies or paying a vendor. Each Pay Out type used will report on its own line. Pay Out Company reasons can be created under Preferences on the Custom Vars page.
Company Pay In Details
Pay Ins accepted for the merchant such as change from paying a vendor. Each Pay Out type used will report on its own line. Pay In Company reasons can be created under Preferences on the Custom Vars page.
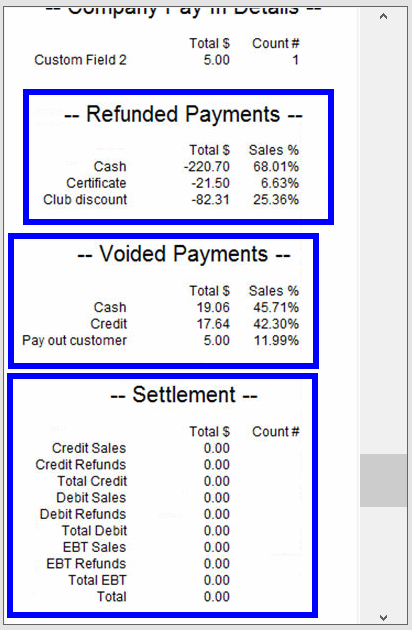
Refunded Payments
Reports on refunds issued organized by tender. Total includes any discounts, tax, tips and fees before or after tendering payment. Refunds, while not calculated within order summary, are deducted from this section.
Voided Payments
Reports on voids issued organized by tender. Total includes any discounts, tax, tips, and fees applied before or after tendering payments. Voids, while not calculated within order summary, are deducted from this section.
Settlement
Reports credit/debit and EBT (where applicable) card payments collected and refunds. Includes all discounts, taxes, tips, and fees applied before or after tendering payment.
Credit Card Transactions
Breaks down card sales by card type, which make up the total reported in the Settlement section.
Online Credit Card Trans.
Card type break down accepted through DeliverMe.
Promotions
Totals all automatically applied promotions. Different promotions applied are listed individually. This includes item level promos, category level promos, and happy hour promos on items and services.
Discounts
Summary data of all discounts and promos. Discounts can be applied at the item level or entire order level. Value reported for promos should match the promotions section above.
- Declared – Tips entered when employee clocks out or as entered in the Delivery Manager.
- Credit – Sum of all credit tips adjusted after sale is processed.
- In Trxs Cash – Sum of all cash tips.
- In Trxs Credit – Sum of all credit tips.
- Total – Total of all tips accepted.
Tips by Staff
Total of all cash and non-cash tips per employee.
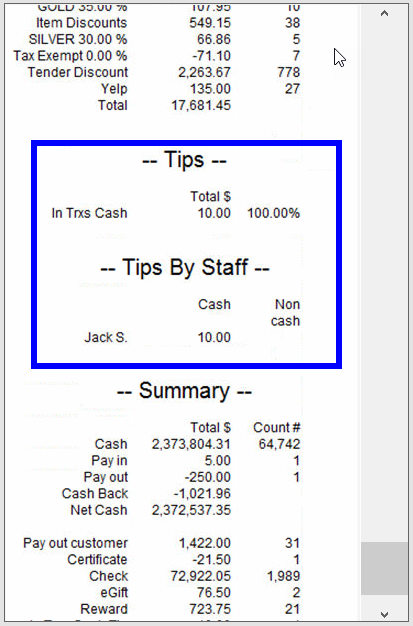
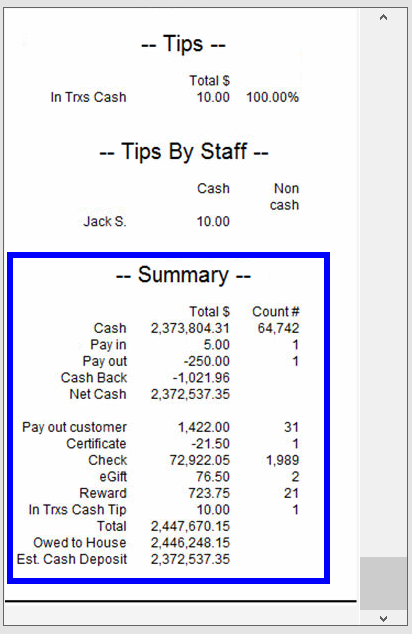
Summary
- Cash – All cash accepted before pay ins and tips, and after refunds and voids.
- Pay In – Pay in company.
- Pay Out – Pay out company.
- Cash Back – Pay out customer and cash back from check payments.
- Net Cash/par – Cash total after Pay Out Company and Cash Back are removed and Pay In is added.
- Pay Out Customer – Pay out customer.
- 3rd Party Delivery – Delivery Services tender option in the Register on the Pay tab.
- Certificate – Exatouch gift certificates.
- Credit – Total credit before any tips.
- Debit – total debit before any tips.
- EBT – Total EBT.
- eGift – Total eGift.
- Reward – Loyalty Rewards point values used.
- Declared Tip – Declared tips entered when clocking out or in Delivery Manager.
- Credit Tip – Credit adjustments through Complete Auth.
- eGift Tip – Tips applied on eGift cards.
- In Trxs Cash Tip – All cash tips accepted before checking out.
- In Trxs Credit Tip – All credit tips accepted before checking out.
- Total – Total of all tendered activity. Includes discounts, tax, tips, and fees.
- Delivery Fee – Revenue from delivery fees.
- Owed to House – Everything collected except non-cash tips, declared tips, in transaction tips, and customer payouts.
- Owed to Staff – Total of credit tips, eGift tips, declared tips, tip in transactions and percent of delivery fee paid to driver.
- Est. Cash Deposit – Remaining cash after paying out tips, and a delivery fee percent to drivers if set. This is not including in transaction cash tips. This total does not include Declared Tips or In Trxs Cash Tips.
The Snapshot by Station report provides a quick overview of your business data directly from the receipt printer, for this station only. No summary version of this report is available.
If you do not have transactional data in a section listed below, it may not appear on the report. Sections can be added and removed by navigating from Home to Settings > Print Settings > Snapshot.
Order Summary
- Open Orders – Sum of all open orders. These orders can be viewed from the Get Order button within the Register. The reported total reflects any discounts except those applied due to tender type. The reported total does not reflect partial payments.
- Transactions – Sum of all items and services sold where payment is collected in full. This is the item total before any discounts or taxes.
- Discounts – Total of all dollar- and percentage-based discounts applied to orders. This includes all line item-, whole order- and tender-based discounts.
- Subtotal – The difference between Transactions and Discounts.
- Taxes – The sum of all tax groups collected after exemptions and refunds. The tax section at the bottom of the report displays taxes collected and refunded per group.
- In Trxs Tips – Sum of all in-transaction tips, applied via Tip Adjustments, Staff Declared Cash Tips, Add/Mod Tips, Touch CFD, or the TableTurn pay at the table device.
- Admin Fee – Adds all tender based fees set in Account settings.
- Convenience Fee – Totals convenience fees generated through DeliverMe.
- Delivery Fee – Sum of all in house and third-party delivery fees collected.
- Other – Sum of other fees collected. This includes promo-based fees defined as a percentage or dollar-base, and is set up in the Items Promos menu. Also included are CRV/DRV fees that are typically used for bottle deposit collection in retail.
- Total – Total collected from all transaction activity. This is not gross sales as defined by GAAP, since it includes tips, admin fees, conv fees, delivery fees, and other fees collected during the transaction.
- Exchanges – Value and amount of all exchanged items.
- Avg. Ticket – Average ticket amount based on count of Transactions and Total from Order Summary section.
Sales By Category
Item total broken down by category. This includes discounts applied, but not sales tax. It also excludes any tips or fees collected. The relative percentage reported is calculated against the sum of all categories.
In-Store Sales by Order Type
Displays sales by in-store order types in the register. This number is the sum of the subtotal and admin fees applied. This total does not include tax.
Online Order Sales by Order Type
Online orders, such as DeliverMe sales. This number is the sum of subtotal and Admin fees applied. This total does not include tax.
Sales by Staff
Sales broken down by staff member who has tendered the order. This total is a sum of subtotal, plus admin fees applied. This does not include tax.
Labor Tracking
- Labor Cost – Hourly wages of all employees. Staff must have an hourly rate set and use the clock in/clock out features.
- Net Sales – Subtotal from Order Summary. Percentage displays how much of the Subtotal goes toward hourly wages.
Sales by Revenue Center
Total of items broken down by defined value for Revenue Center definition found on Item’s Details. This number includes discounts applied. If there is no Center defined, values will report as unclassified.
Sales by Revenue Class
Total of items broken down by defined value for Revenue Class definition found on Item’s Details. This number includes discounts applied. If there is no Class defined, values will report as unclassified.
Net Sales By Day Part
Item totals broken down by user created time boxes throughout the day. Reported figures include discounts. Day Parts are defined within the Snapshot tab under Print Settings. They are optional, and report along with the cumulative total.
Taxes
- Sales – Taxes collected. The taxable amount used to derive total tax collected can be found on the Taxes report, and includes discounts applied to items. Depending on settings, it may also reflect service fees applied to orders.
- Refunds – Taxes refunded. The taxable amount used to derive total tax refunded can be found on the Taxes report, and includes discounts applied to items.
- Total – Difference between sales and refunded taxes collected for each group.
- Exempt – Any taxes exempt on an order. Based on payment method or customer status exemption.
Payment Transactions
Reporting of all tenders collected. The reported numbers for each tender are based on total collected, inclusive of any discounts, tax, tips, and fees applied before or after tendering payment.
Customer Pay Out Details
Pay Outs issued for customers such as bottle returns or lottery payouts. Each Pay Out type used reports on its own line. Pay Out Customer reasons can be created under Preferences on the Custom Vars page.
Company Pay Out Details
Pay Outs issued for the merchant such as supplies or paying a vendor. Each Pay Out type used will report on its own line. Pay Out Company reasons can be created under Preferences on the Custom Vars page.
Company Pay In Details
Pay Ins accepted for the merchant such as change from paying a vendor. Each Pay Out type used will report on its own line. Pay In Company reasons can be created under Preferences on the Custom Vars page.
Refunded Payments
Reports on refunds issued organized by tender. Total includes any discounts, tax, tips and fees before or after tendering payment. Refunds, while not calculated within order summary, are deducted from this section.
Voided Payments
Reports on voids issued organized by tender. Total includes any discounts, tax, tips, and fees applied before or after tendering payments. Voids, while not calculated within order summary, are deducted from this section.
Settlement
Reports credit/debit and EBT (where applicable) card payments collected and refunds. Includes all discounts, taxes, tips, and fees applied before or after tendering payment.
Credit Card Transactions
Breaks down card sales by card type, which make up the total reported in the Settlement section.
Online Credit Card Trans.
Card type break down accepted through DeliverMe.
Promotions
Totals all automatically applied promotions. Different promotions applied are listed individually. This includes item level promos, category level promos, and happy hour promos on items and services.
Discounts
Summary data of all discounts and promos. Discounts can be applied at the item level or entire order level. Value reported for promos should match the promotions section above.
- Declared – Tips entered when employee clocks out or as entered in the Delivery Manager.
- Credit – Sum of all credit tips adjusted after sale is processed.
- In Trxs Cash – Sum of all cash tips.
- In Trxs Credit – Sum of all credit tips.
- Total – Total of all tips accepted.
Tips by Staff
Total of all cash and non-cash tips per employee.
Summary
- Cash – All cash accepted before pay ins and tips, and after refunds and voids.
- Pay In – Pay in company.
- Pay Out – Pay out company.
- Cash Back – Pay out customer and cash back from check payments.
- Net Cash/par – Cash total after Pay Out Company and Cash Back are removed and Pay In is added.
- Pay Out Customer – Pay out customer.
- 3rd Party Delivery – Delivery Services tender option in the Register on the Pay tab.
- Certificate – Exatouch gift certificates.
- Credit – Total credit before any tips.
- Debit – total debit before any tips.
- EBT – Total EBT.
- eGift – Total eGift.
- Reward – Loyalty Rewards point values used.
- Declared Tip – Declared tips entered when clocking out or in Delivery Manager.
- Credit Tip – Credit adjustments through Complete Auth.
- eGift Tip – Tips applied on eGift cards.
- In Trxs Cash Tip – All cash tips accepted before checking out.
- In Trxs Credit Tip – All credit tips accepted before checking out.
- Total – Total of all tendered activity. Includes discounts, tax, tips, and fees.
- Delivery Fee – Revenue from delivery fees.
- Owed to House – Everything collected except non-cash tips, declared tips, in transaction tips, and customer payouts.
- Owed to Staff – Total of credit tips, eGift tips, declared tips, tip in transactions and percent of delivery fee paid to driver.
- Est. Cash Deposit – Remaining cash after paying out tips, and a delivery fee percent to drivers if set. This is not including in transaction cash tips. This total does not include Declared Tips or In Trxs Cash Tips.
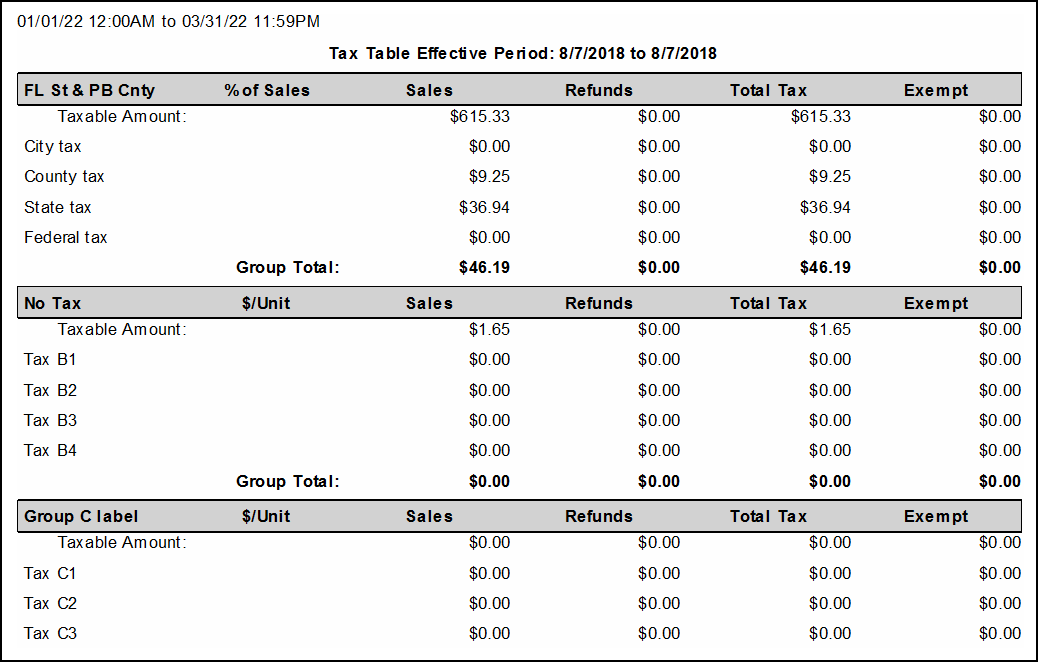
Taxes reports give merchants a complete breakdown of all tax groups collected for any given period. Reports are organized by tax group.
A Tax Table Effective Period displays at the top of the report. This indicates the period when no changes were made to the tax settings. If a merchant updates or changes tax settings one or more times for the report’s date range, multiple pages with each Tax Table Effective Period display.
- Group and Subgroups – Each group gets a Taxable Amount row here.
- % or Unit – The percentage of sales attributed to the tax rate.
- Sales – Taxable amount from items charged that have selected tax group enabled.
- Refunds – Amount of any refunds.
- Total Tax – Sales minus Refunds.
- Exempt – Sales from orders that were tax-exempt or EBT payments.
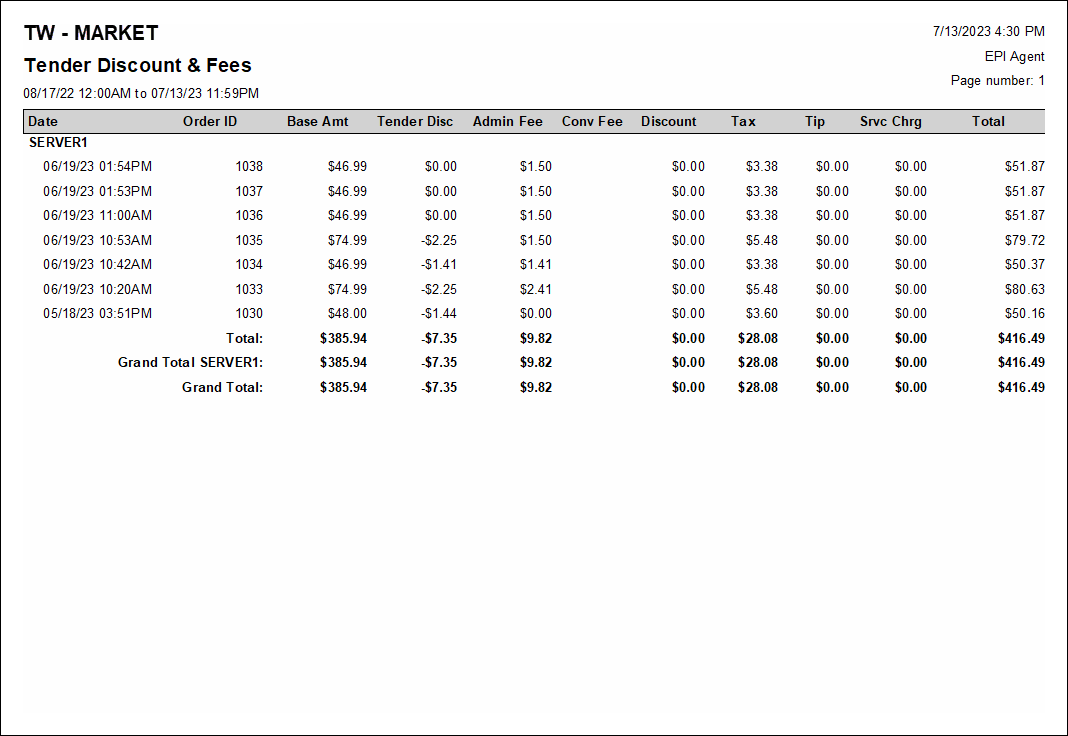
Tender Discount & Fees reports list all fees applied to transactions. Reports display fees per Order ID and organize orders in chronological order.
- Date – Date and time of the sale.
- Order ID – Order ID from sale/transaction/order.
- Base Amt – Amount of all items or services pre-discount, tax, tip, and other fees.
- Tender Disc – Tender based discounts (set up in Account Settings).
- Admin Fee – Admin fee (set up in Account Settings).
- Conv Fee – Fee applied on order from DeliverMe site.
- Tax – Taxes applied.
- Tip – Tips applied to the order.
- Serv Chrg – Delivery fee.
- Total – Order total.
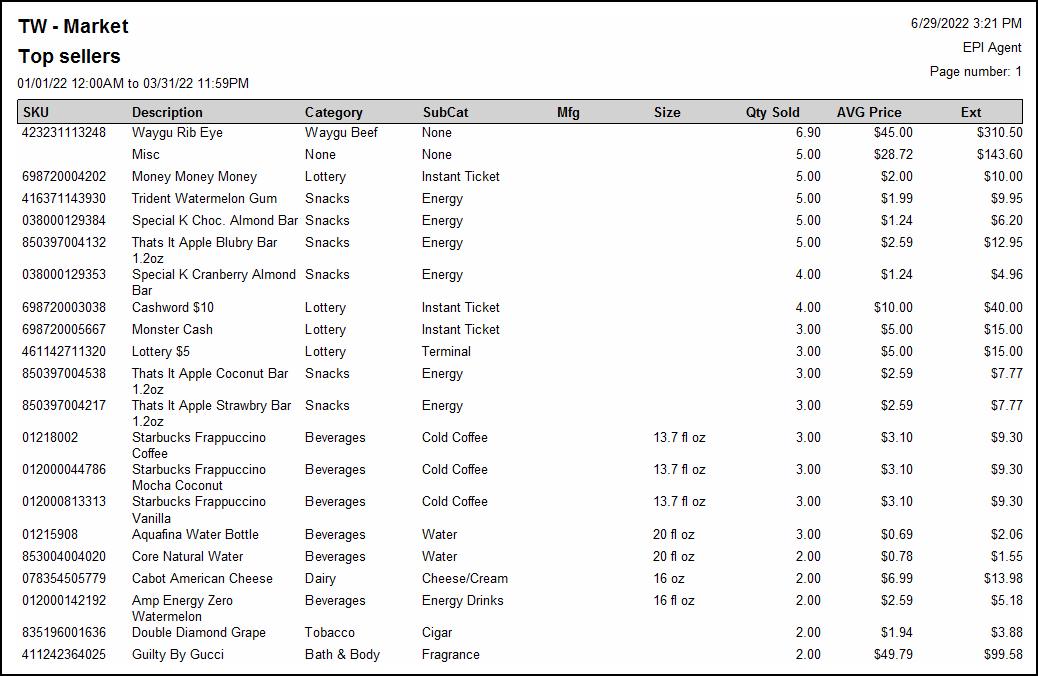
Top Selling Items reports provide merchants with item sales organized by the items most frequently sold. A Grand Total displays sums for the Qty Sold and Ext columns at the bottom of the report. Refund by Item does not create records on this report.
- SKU – Primary SKU number of item.
- Description – Name of item.
- Category – Category of item sold. If selected on a Misc Sale, it will display here.
- SubCat – Sub Category of item sold. If selected on a Misc Sale, it will display here.
- Mfg – Name of item manufacturer.
- Size – Size of the item. This is not the Pack Size from the Pricing tab.
- Qty Sold – Quantity of item(s) sold.
- AVG Price – Average price at which item was sold. This number is affected by discounts applied to item.
- Ext – Price (minus discount) for every record in the report.
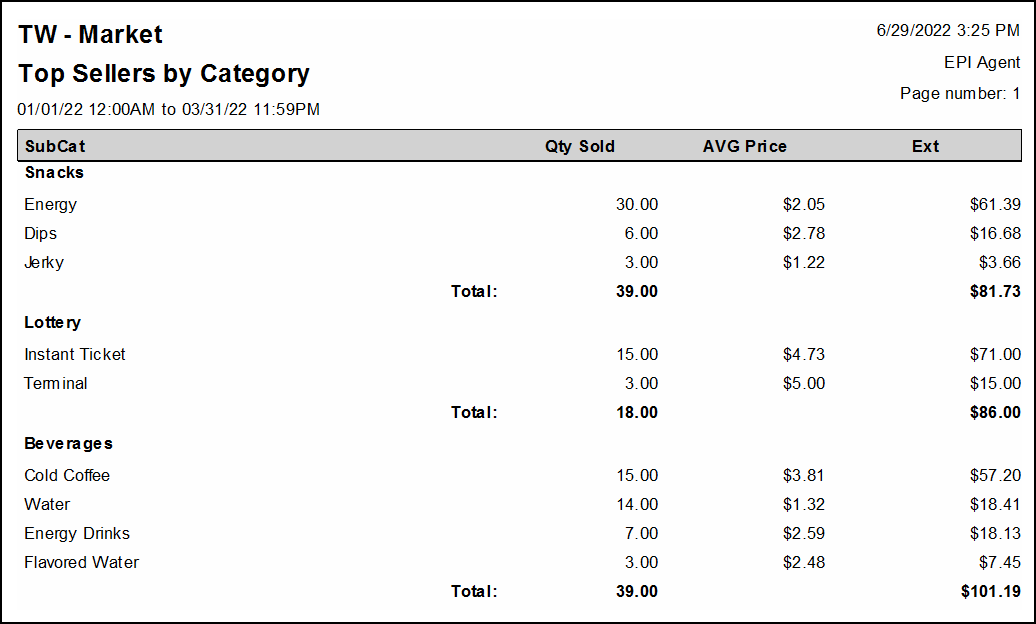
Top Selling Categories reports provide merchants with category sales organized by items most frequently sold.
- SubCat – Sub Category of item sold. If selected on a Misc Sale, it will display here.
- Qty Sold – Quantity of item(s) sold.
- AVG Price – Average price at which item was sold. This number is affected by discounts applied to item.
- Ext – Price (minus discount) for every record in the report.
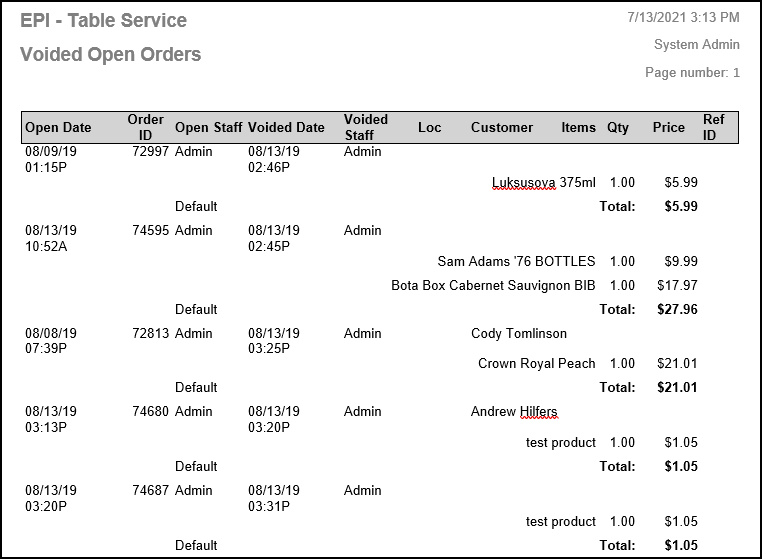
Voided Open Orders provide a list of all orders saved, but not completed in the Register.
- Open Date – Date and time the order was opened.
- Order ID – Order ID created when an order is saved.
- Open Staff – Staff who initially saved the order.
- Voided Date – Date and time order was voided.
- Voided Staff – Staff who deleted the order.
- Loc – Floor Plan label, if used.
- Customer – Customer record attached to the order (if applicable).
- Items – Items added to deleted order.
- Qty – Quantity of items added to an order.
- Price – Item price multiplied by order quantity.
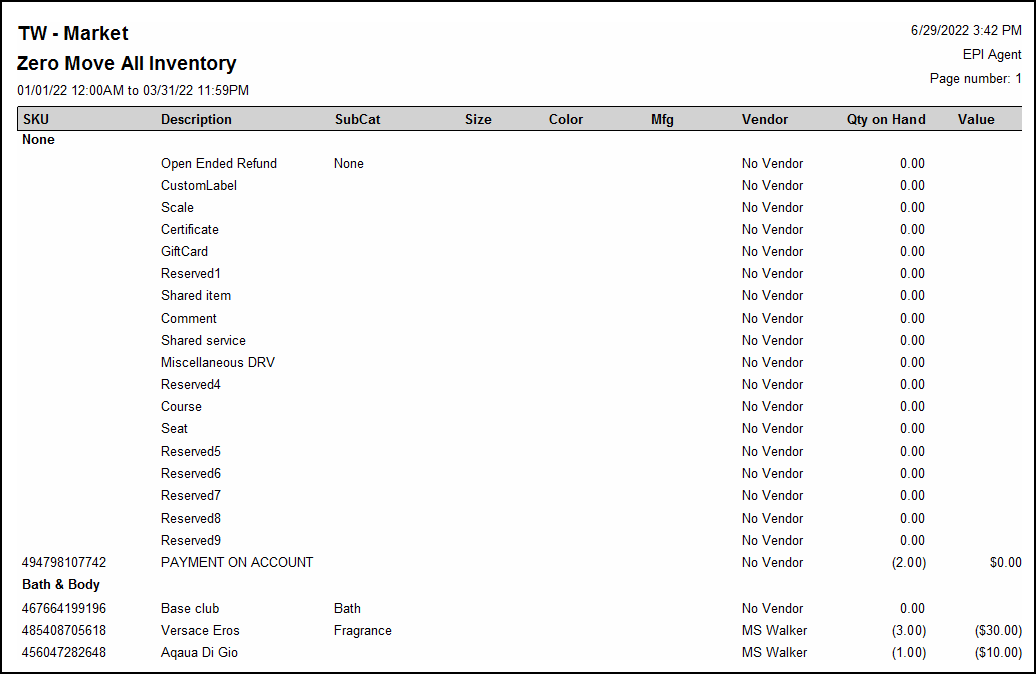
Zero Movement All Inventory reports provides a list of all items that have had no change in stock quantity for the selected time range.
- SKU – Primary SKU number of item.
- Description – Name of item.
- SubCat – Sub Category of item sold. If selected on a Misc Sale, it will display here.
- Size – Size of the item. This is not the Pack Size from the Pricing tab.
- Color – Color of an item.
- Mfg – Name of item manufacturer.
- Vendor – Default vendor of the item.
- Qty on Hand – Quantity of items in stock at time of report run.
- Value – Cost of item from vendor, multiplied by quantity on hand.
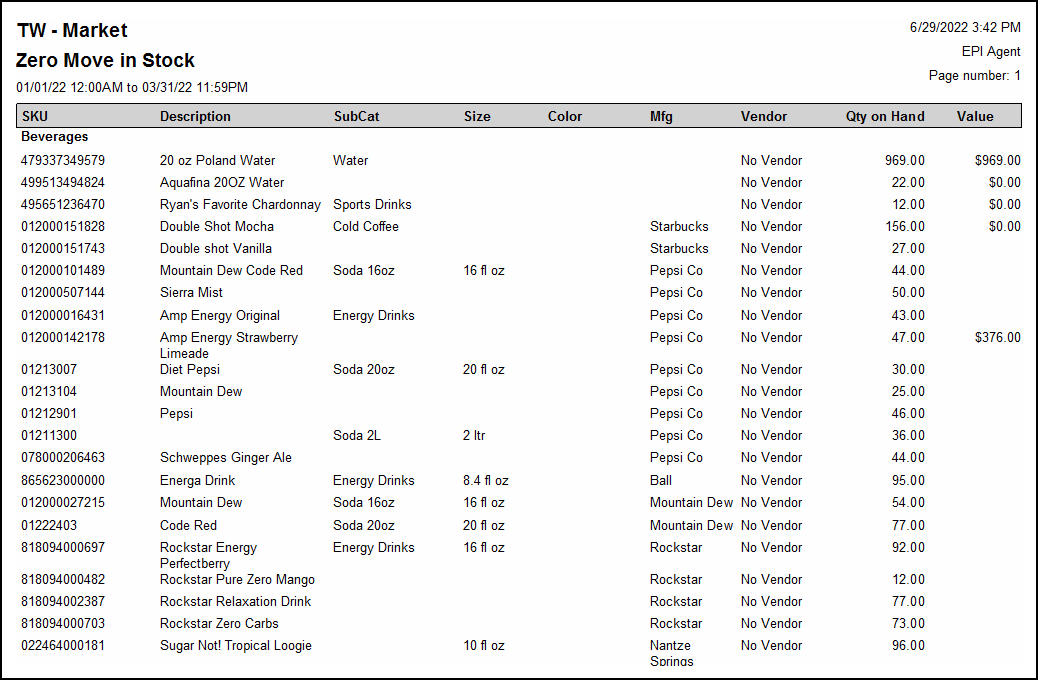
Zero Move in Stock Reports provide a list of items in stock that have not changed in stock quantity for the selected time range.
- SKU – Primary SKU number of item.
- Description – Name of item.
- SubCat – Sub Category of item sold. If SubCat selected on a Misc Sale, it will display here.
- Size – Size of the item. This is not the Pack Size from the Pricing tab.
- Color – Color of an item.
- Mfg – Name of item manufacturer.
- Vendor – Default vendor of the item.
- Qty on Hand – Quantity of items in stock at time of report run.
- Value – Cost of item from vendor, multiplied by quantity on hand.
How can we improve this information for you?
Registered internal users can comment. Merchants, have a suggestion? Tell us more.