The Items reports allows merchants to review items sold by the business. Merchants can review inventory levels, prices, and other data for every item they sell. This helps merchants determine at a glance the exact quantity of items in inventory so they can reorder only those items that they need, increasing efficiency and cost savings.
- Note: Leave your Exatouch Systems powered up and connected to the internet to generate and deliver scheduled reports.
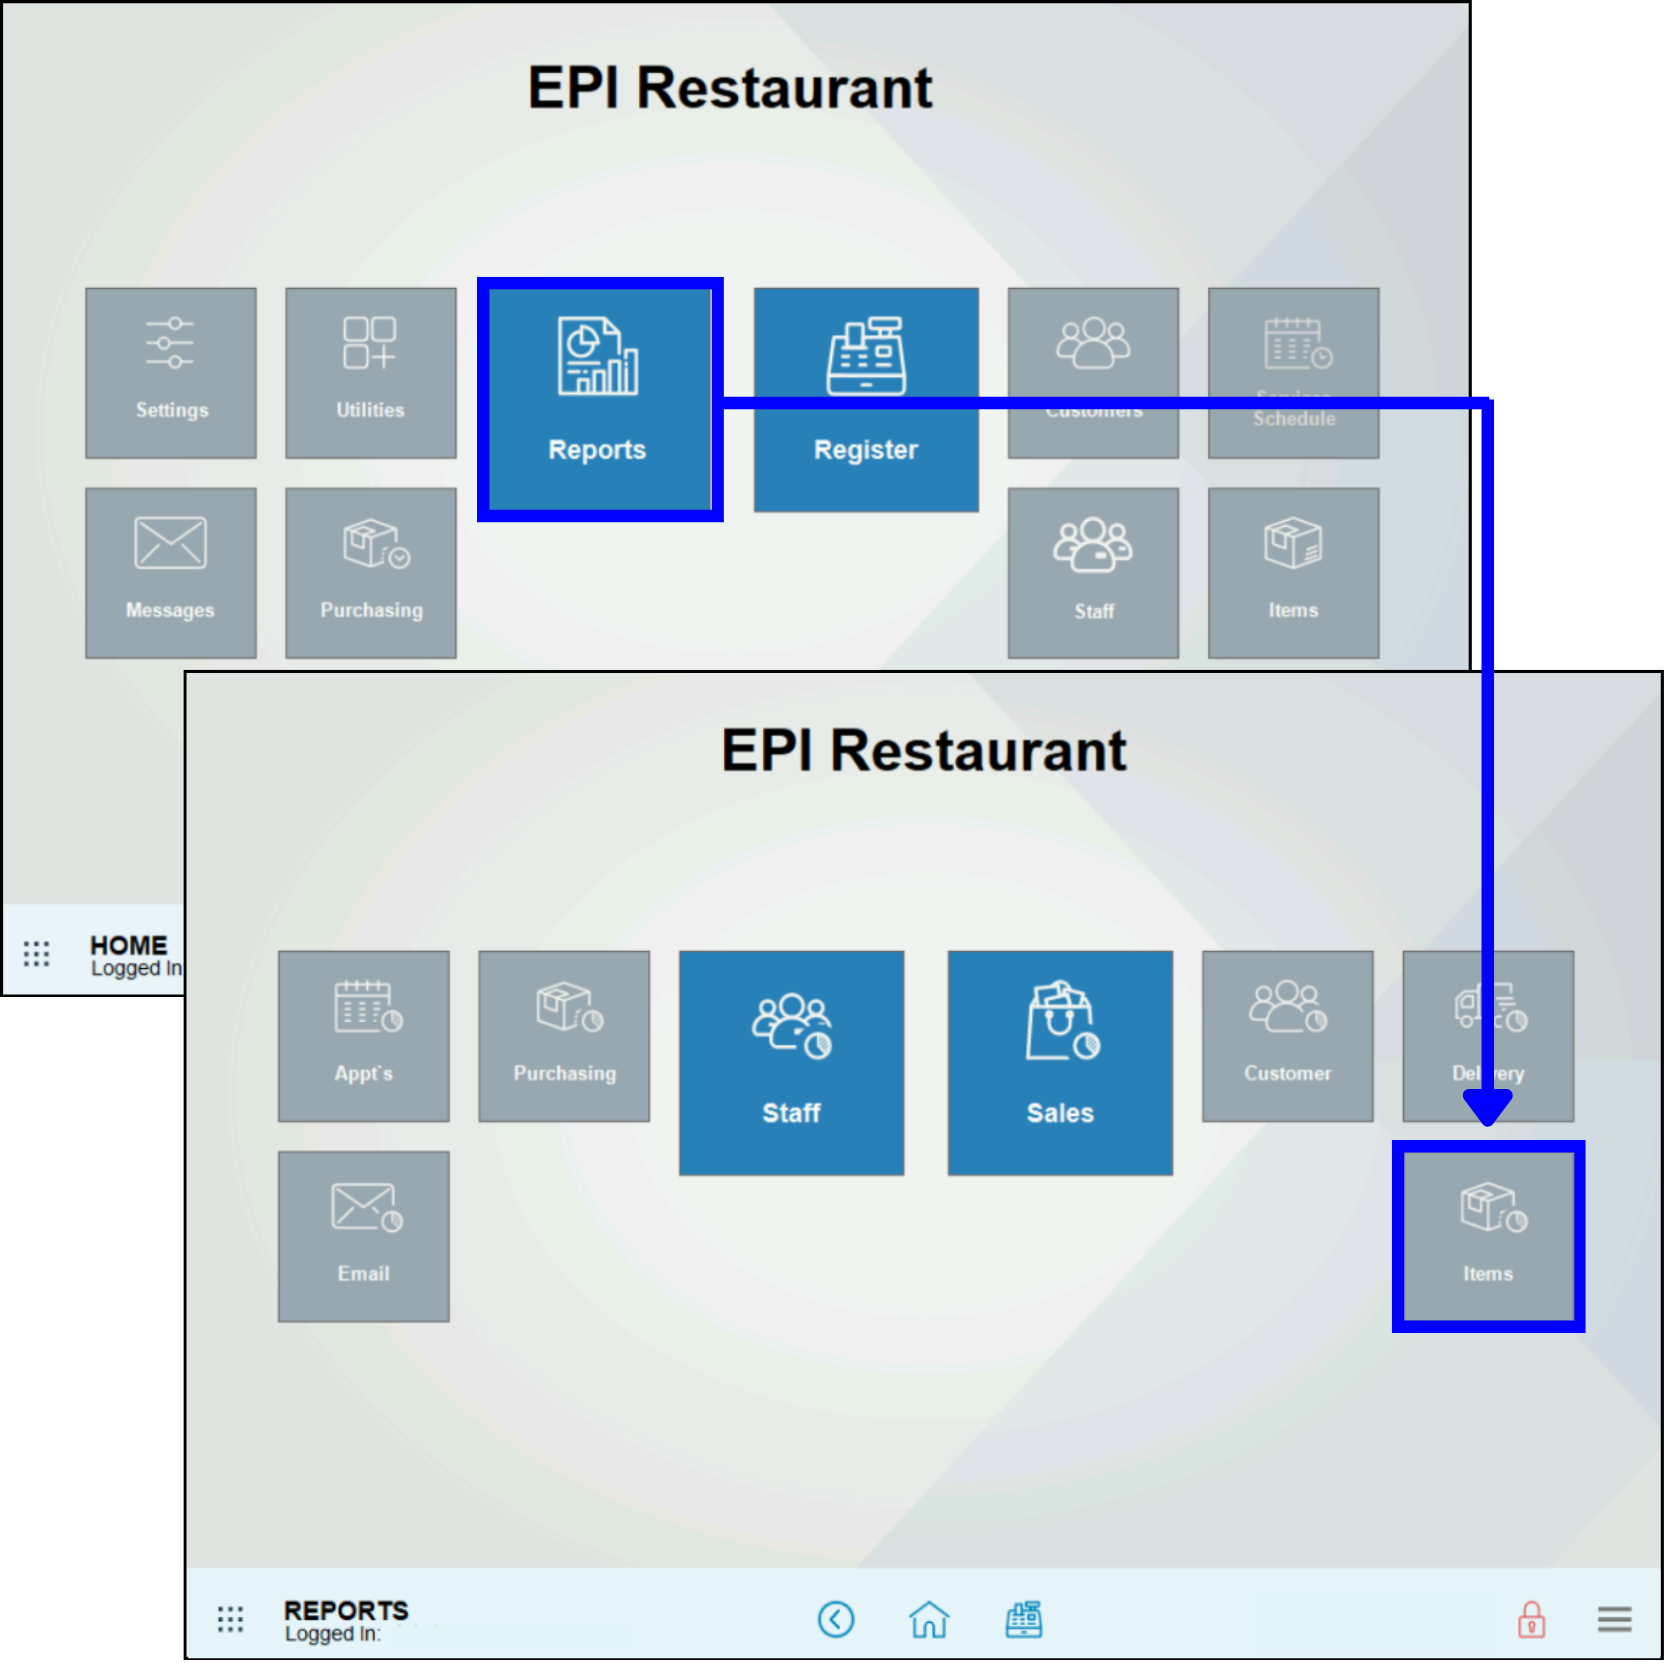
- From Home, navigate to Reports > Items to display the Items Reports page.
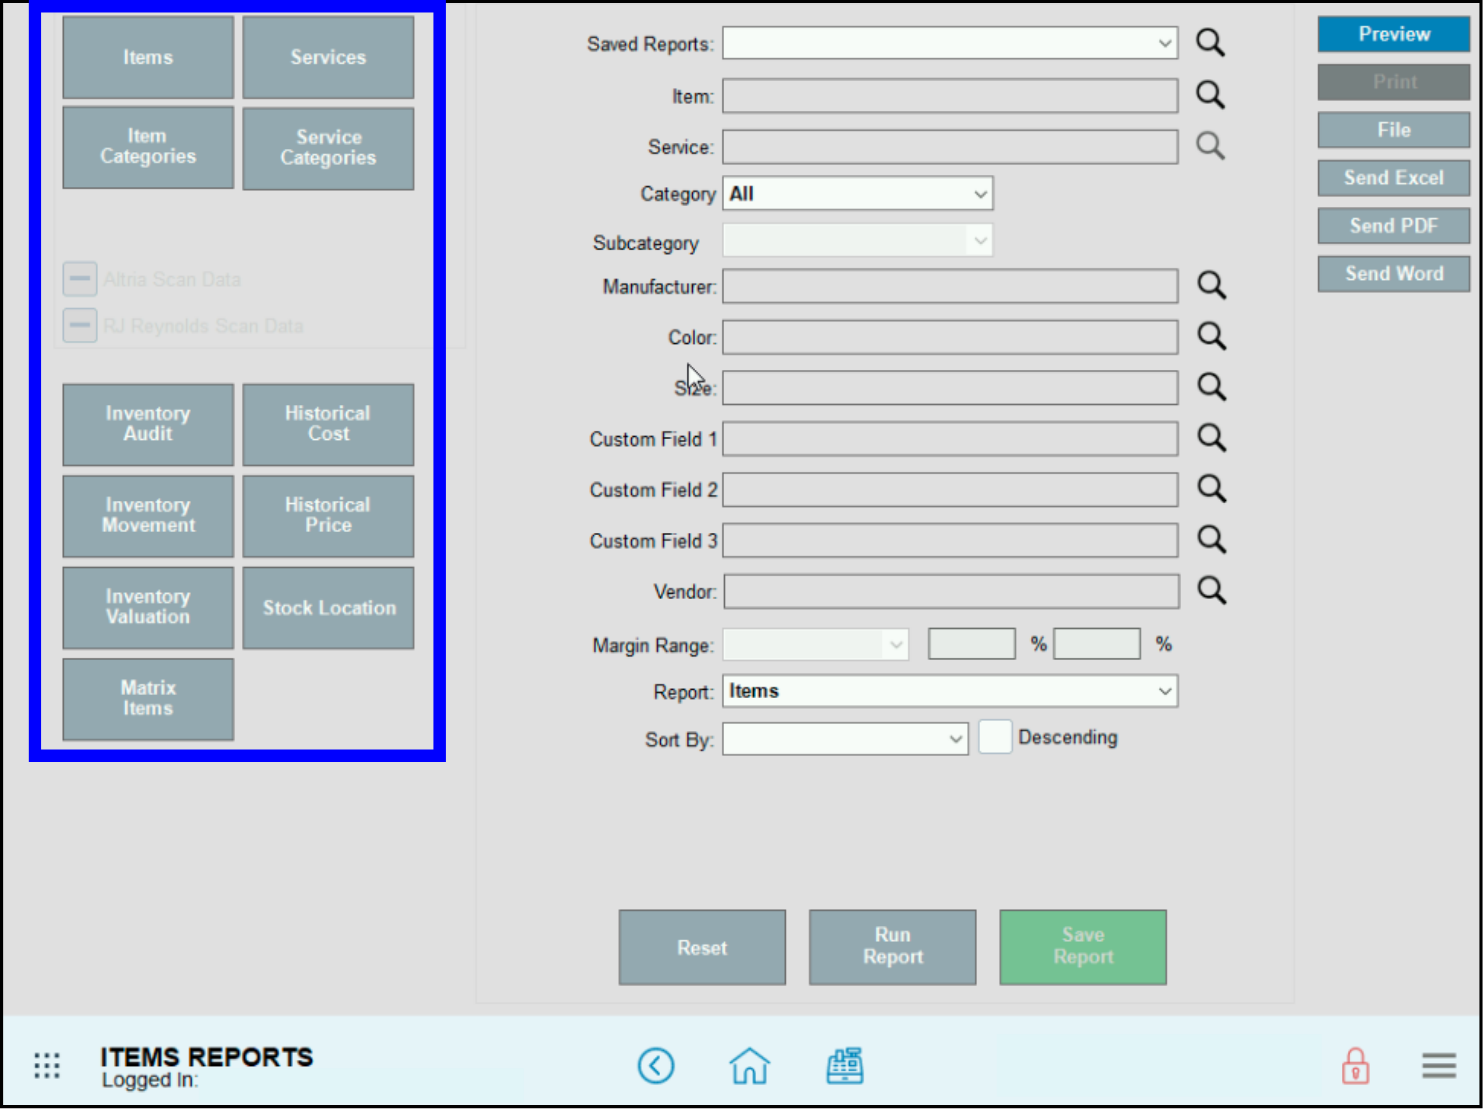
- Tap the name of your report to run: Items, Services, Items Categories, Services Categories, Inventory Audit, Historical Cost, Inventory Movement, Historical Price, Inventory Valuation, Stock Location, or Matrix Items.
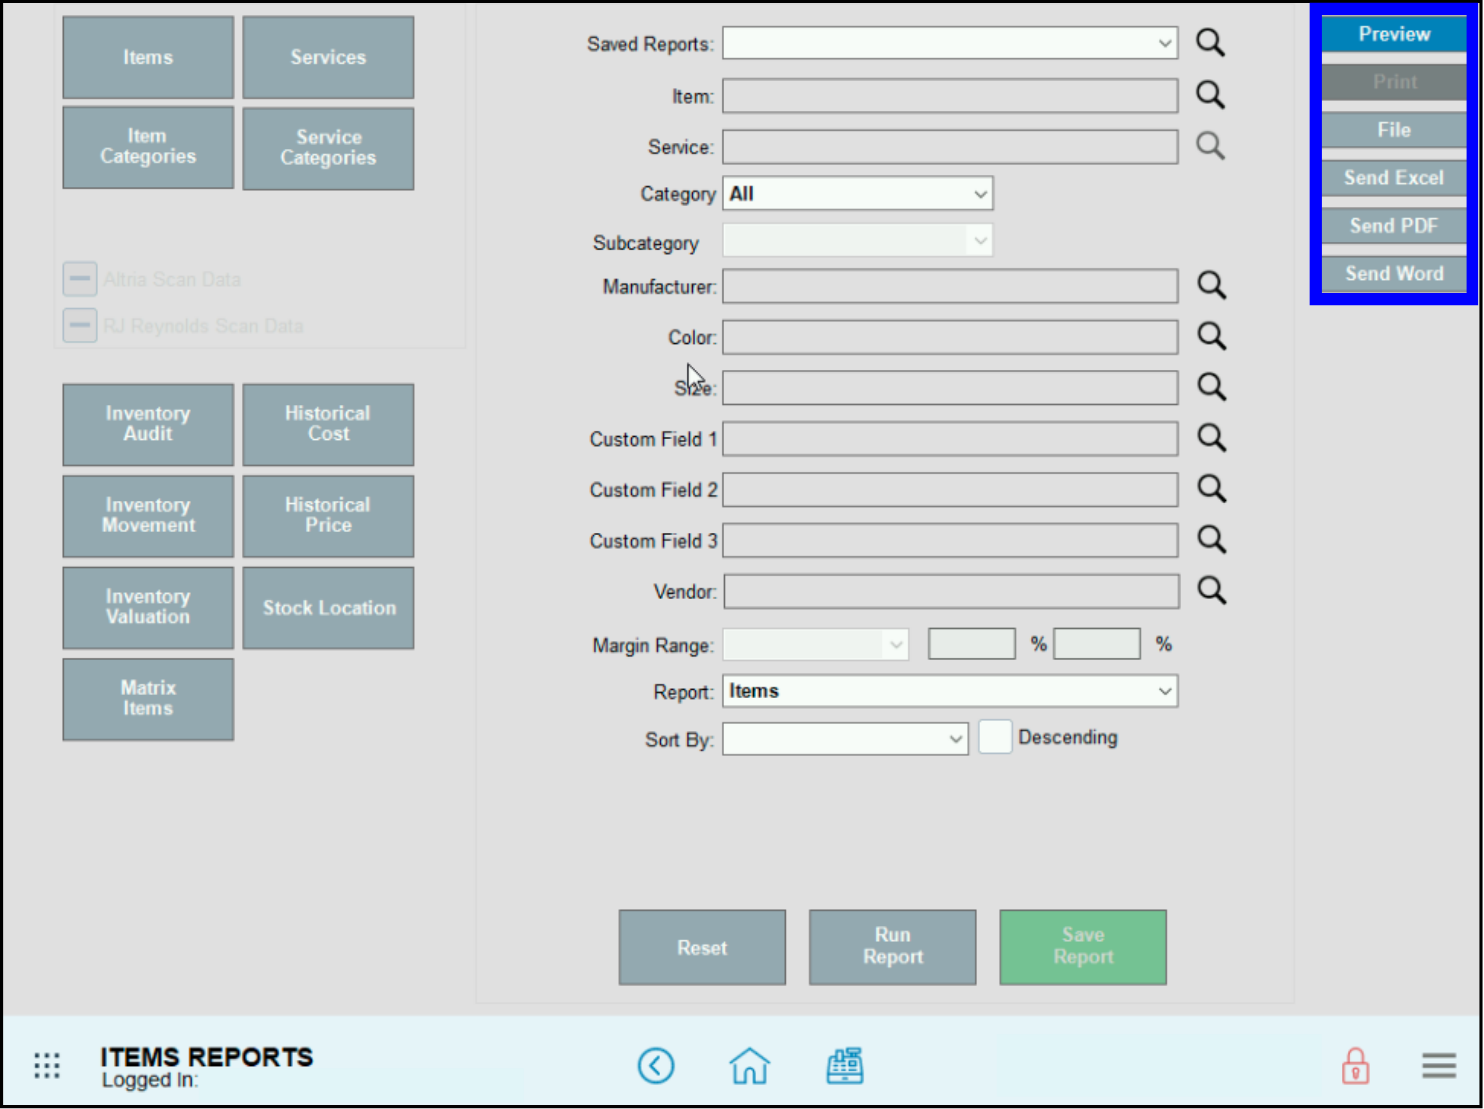
- Select a report format option:
- Preview – Generate and display the report on screen
- Print – Generate and print to your report printer
- File – Generate save to an inserted USB thumb drive
- Send Excel – Generate and prepare to send in Excel format (.xlsx, .xls) as an email attachment
- Send PDF – Generate and prepare to send in PDF format as an email attachment
- Send Word – Generate and prepare to send in Word format (.docx, .doc) as an email attachment
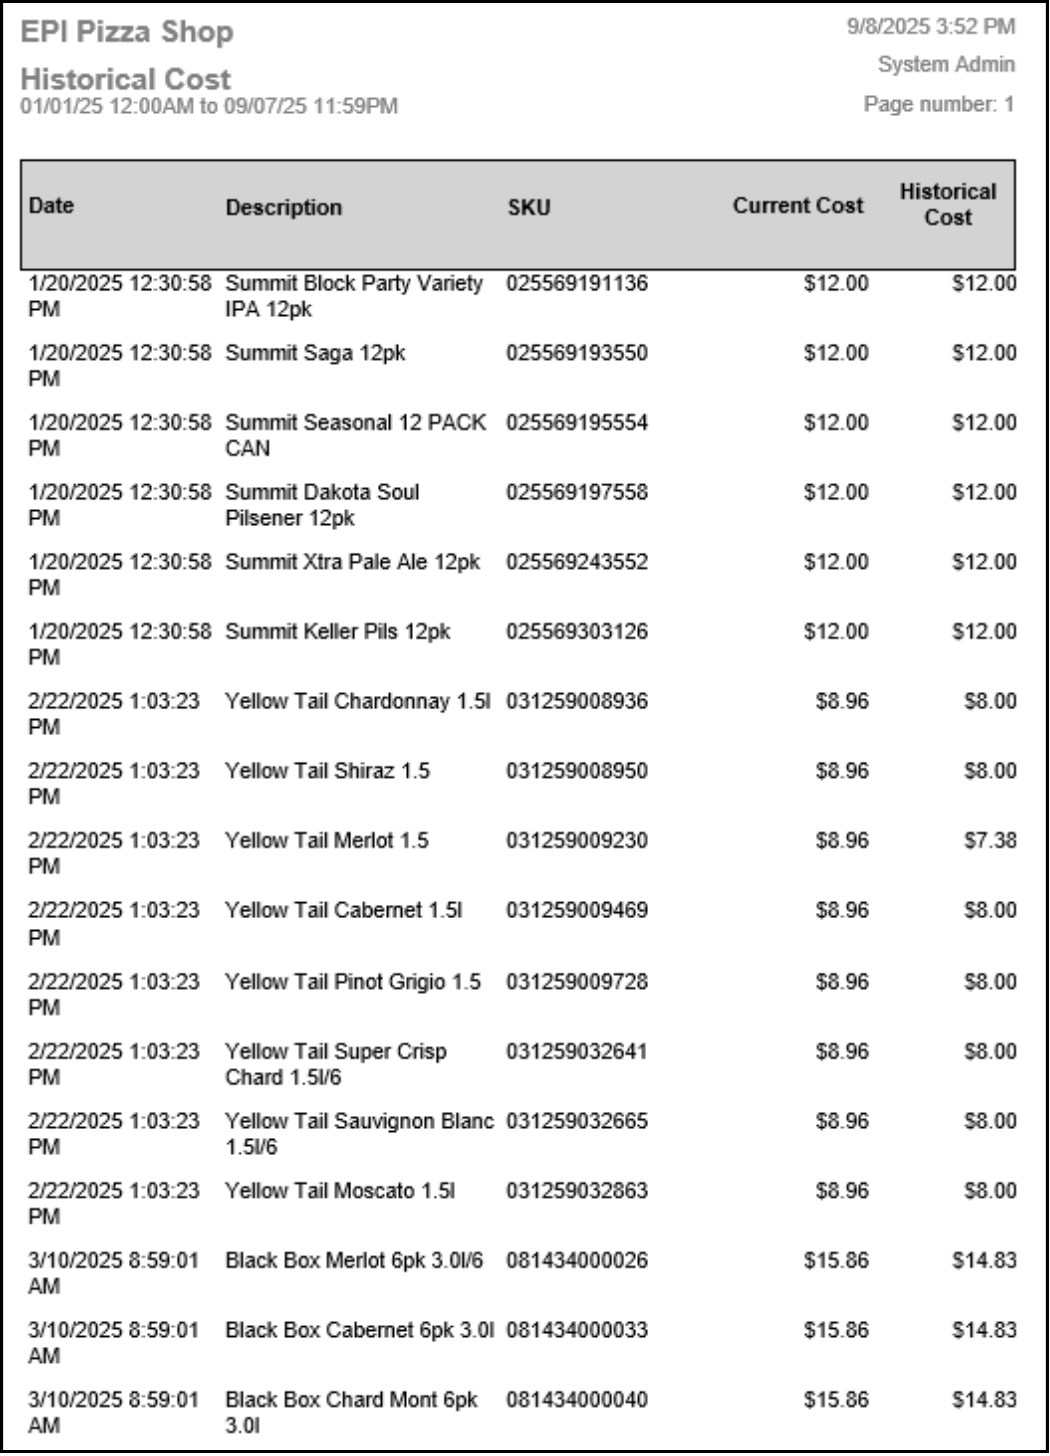
The Historical Cost Report tracks changes to an item’s user-entered cost. It also records updates made when the item is received through a purchase order (PO) or the Receive module. Updates appear in chronological order, and items only show in the report once a cost change has occurred.
- The User Entered Cost is the only option out of the cost fields that will affect this report.
- The user cannot adjust the date and time for this report. Data given is a lifetime report.
- An item only appears one time on the report. The record displayed is the most recent cost update. Older updates are rewritten.
- Date – The date and time the cost change was made.
- Description – Item Name saved.
- SKU – Item’s SKU saved.
- Current Cost – The current User Entered Cost.
- Historical Cost – The User Entered Cost before the update was performed.
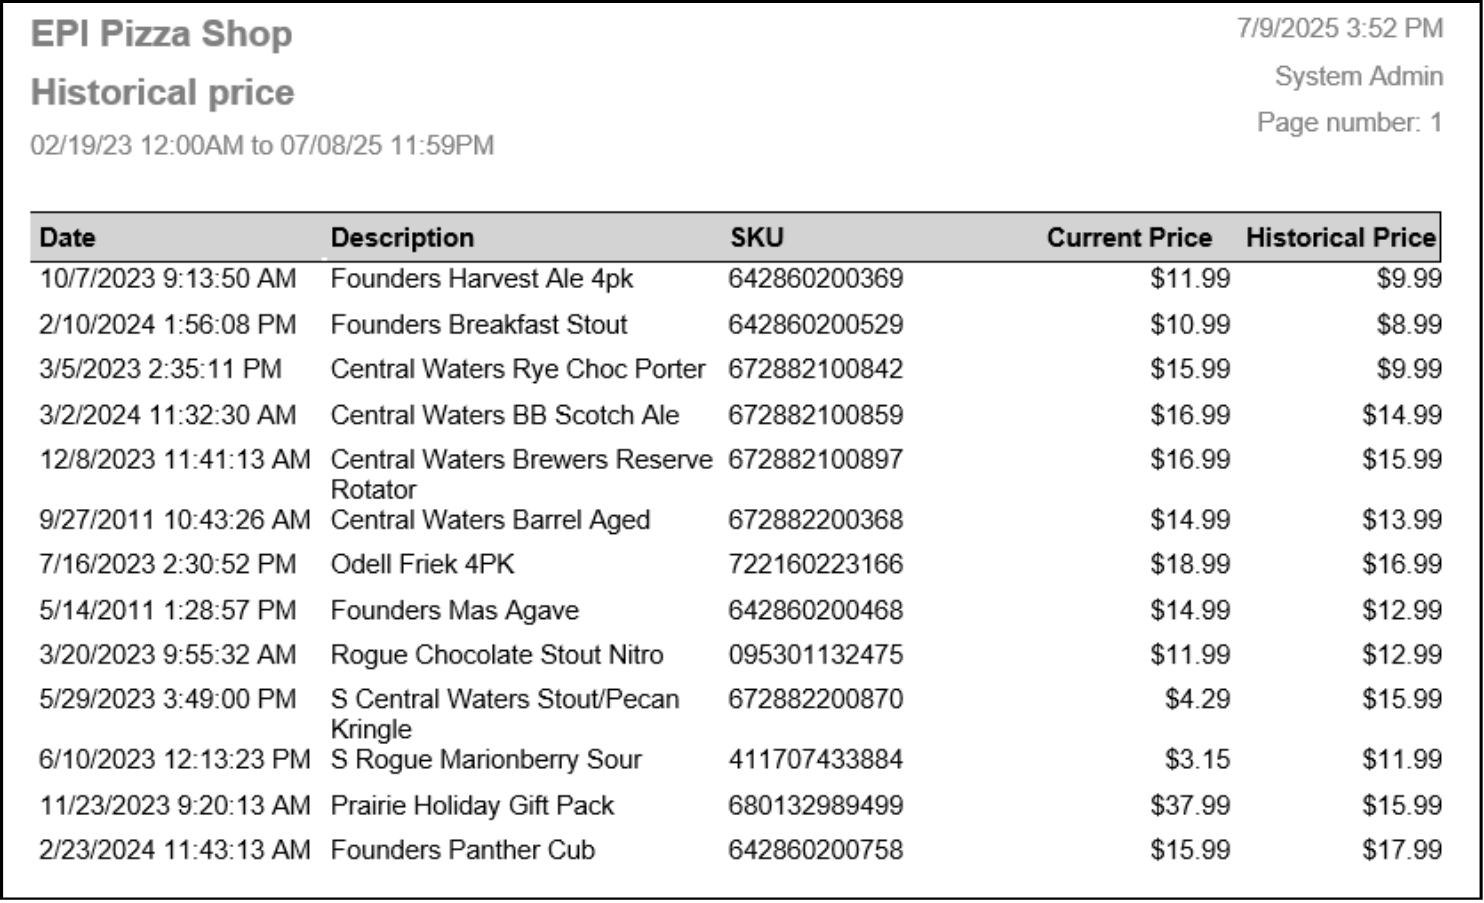
The Historical Price Report tracks changes made to an item’s sale price on the Item Details page. The report automatically records the exact date and time of each change, which cannot be modified. It provides a lifetime record of all price updates.
- Items will not show on report until a price change is made. Once it goes to the report, it is there forever.
- An item will only show one time on the report. The record displayed is the most recent price update. Older updates are rewritten.
- Date – The date and time the price change was made.
- Description – Item Name saved.
- SKU – Item’s SKU saved.
- Current Price – The current sale price.
- Historical Price – The sale price before the update was performed.
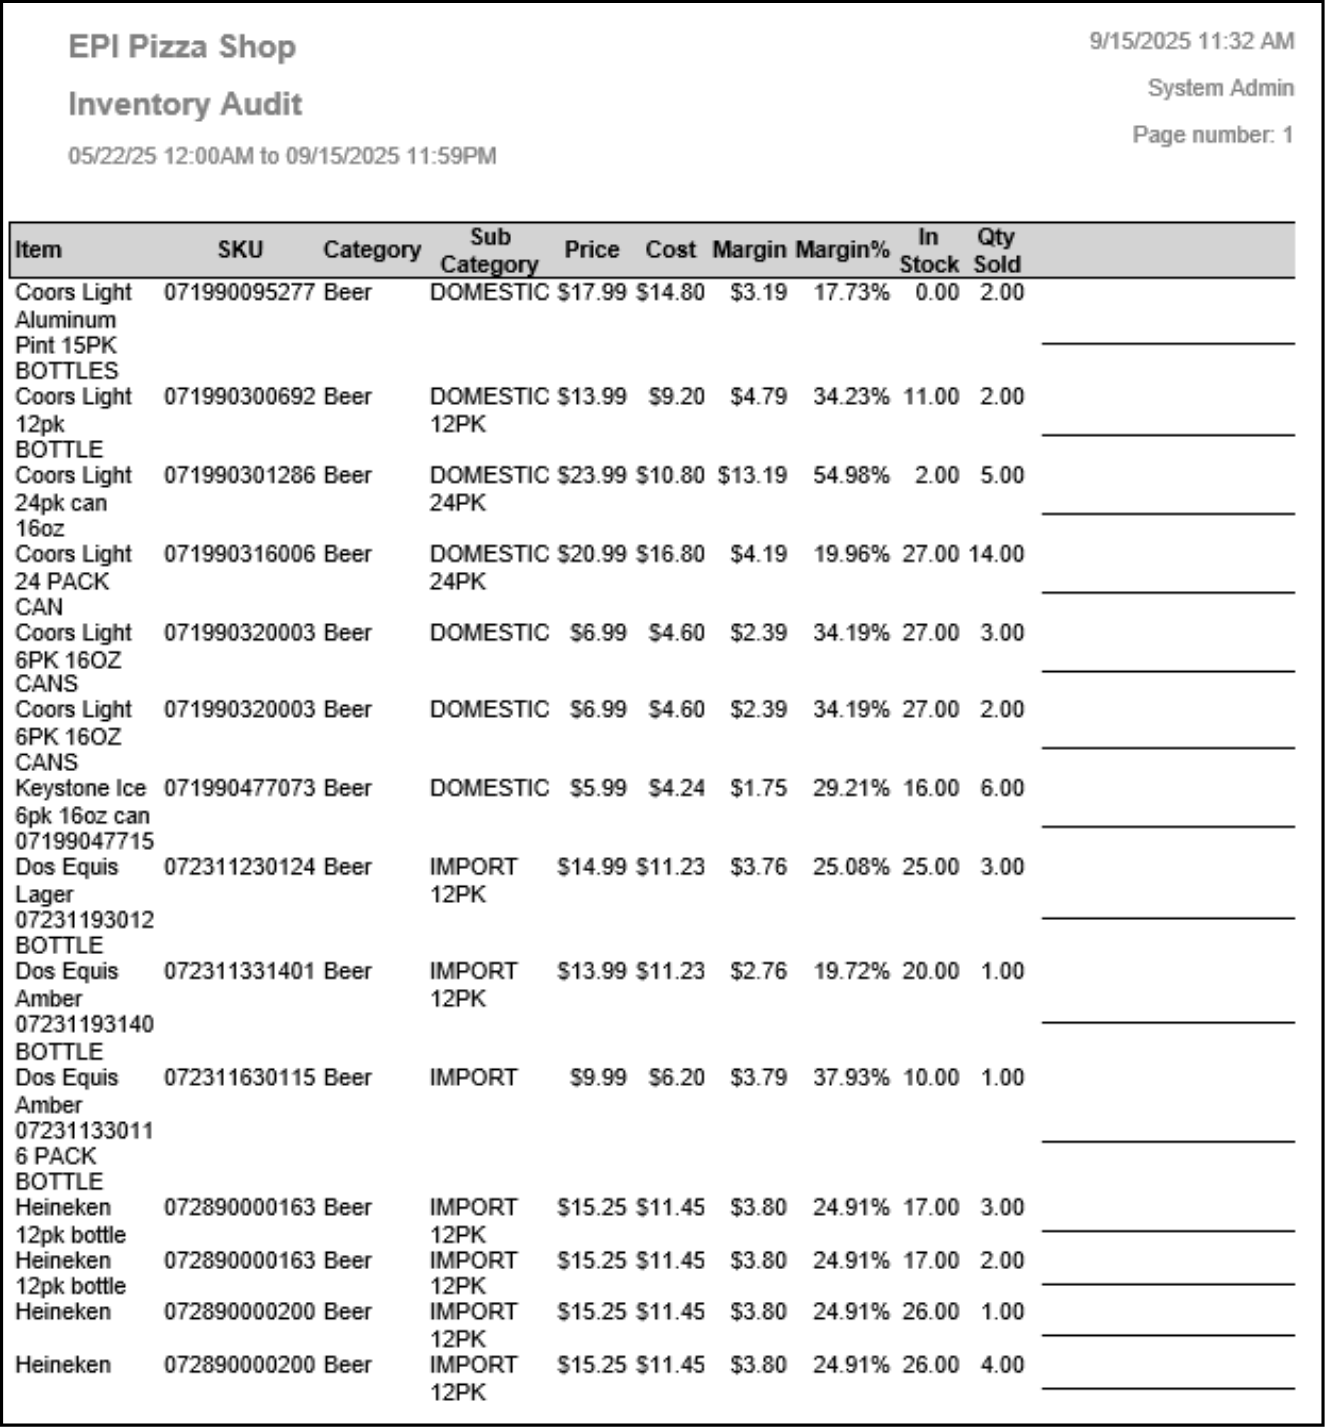
The Inventory Audit Report shows items sold during a selected time period, organized by SKU, along with margins earned. Unsold items and Misc. Sales do not appear. A blank column on the right is provided for merchants to print the report and record inventory counts in-store.
- Item – This will display the Item Name saved on the Items Detail page.
- SKU – The SKU saved on Items Details.
- Category – This will display the item’s Category saved on the Items Detail page.
- Sub Category – This will display the item’s Sub Category saved on the Items Detail page.
- Price – The price save on the item. Not including any taxes, fees or if a price override is completed.
- Cost – This field will display the cost field the user has select in Items details. This field can be dynamic if the user selects Average, Recently or Least Paid.
- Margin – The margin earned based off the Price and user selected Cost.
- Margin % – The margin percentage earned based off the Price and user selected Cost.
- In Stock – Will display the quantity on hand.
- Qty Sold – Qty Sold will display the items count that was sold for the given period.
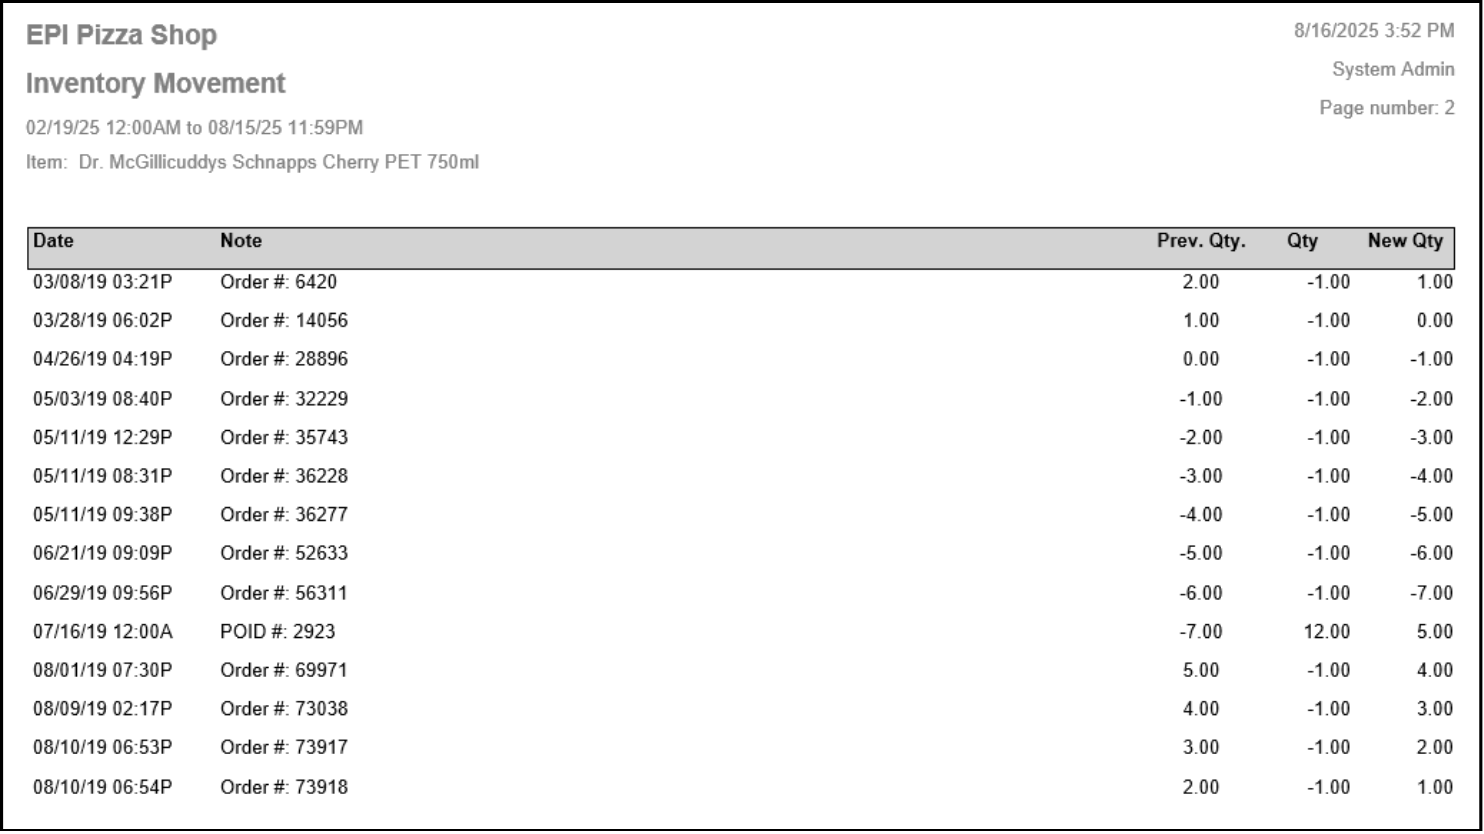
The Inventory Movement Report shows all changes to a single item’s inventory within a selected date range. Movements such as sales, refunds, manual adjustments, and purchase orders are listed in chronological order. Every inventory change for an item is recorded in this report.
- Date – Date and time of inventory movement. If a PO or Receive is completed, the time displayed is always midnight.
- Note: This will display why the inventory was moved. If a sale or refund was completed the Order ID will be included. The adjustment reason entered on the Items Details page, the Count feature and the Receive feature will display here. If a Purchase Order was completed the POID will display.
- Prev. Qty – The quantity before the inventory was changed.
- Qty – The quantity of the change happening.
- New Qty – The quantity after the inventory was updated.
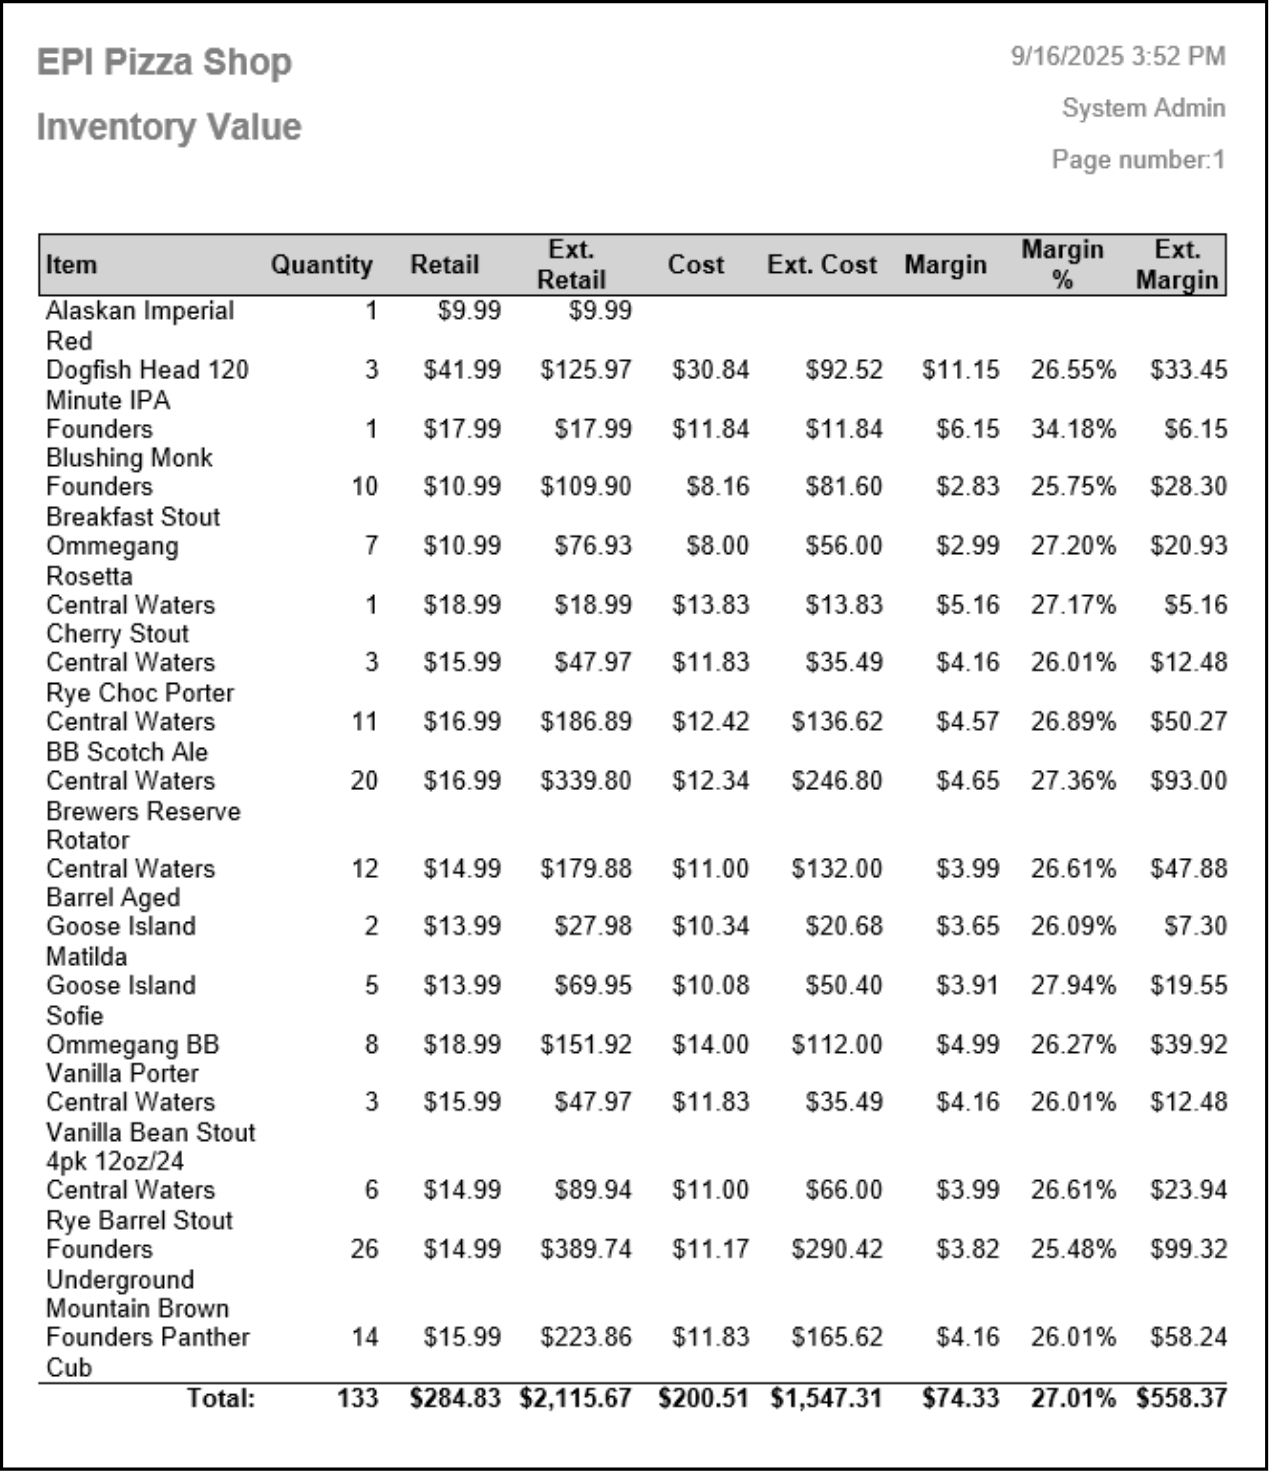
The Inventory Valuation Report calculates the value of items based on details from the Item Details page. It uses current inventory only (no date range). Items without cost data may show blank columns, and items with zero quantity on hand will not appear.
- Item – The item description.
- Quantity – Current quantity on hand.
- Retail – The items sale price without any taxes and fees applied.
- Ext. Retail – Retail price multiplied by the quantity on hand.
- Cost – The cost selected on the Items Details page. This can be the User Entered, Average, Recently, or Least Paid.
- Ext. Cost – Cost multiplied by the quantity on hand.
- Margin – The difference between the Retail price and the merchant Cost.
- Margin % – Margin percentage made each time the item is sold.
- Ext. Margin – The difference between the Ext. Retail price and the merchant Ext. Cost
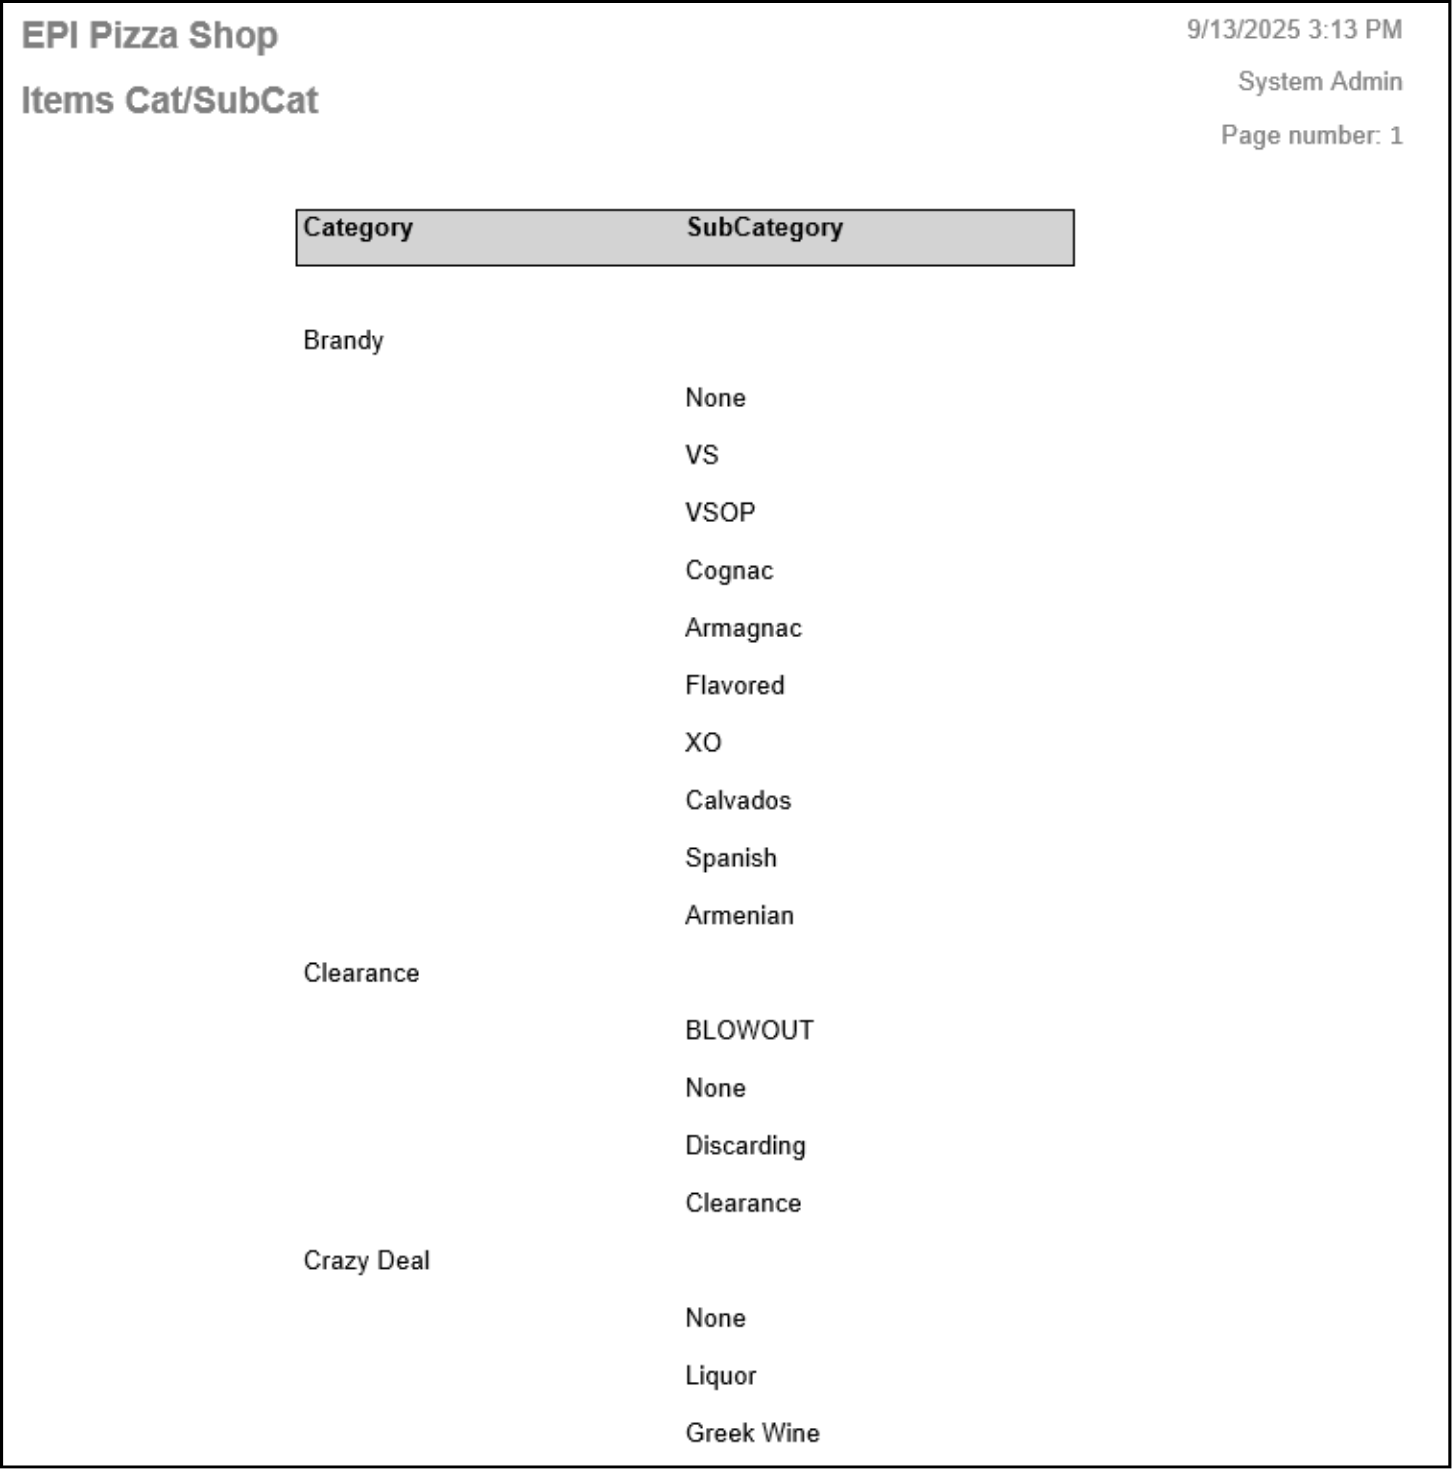
The Items Category Report provides merchants with the categories in their Exatouch POS.
- Category – Main Category containing items.
- Sub Category – Breaks down Categories into smaller groups.
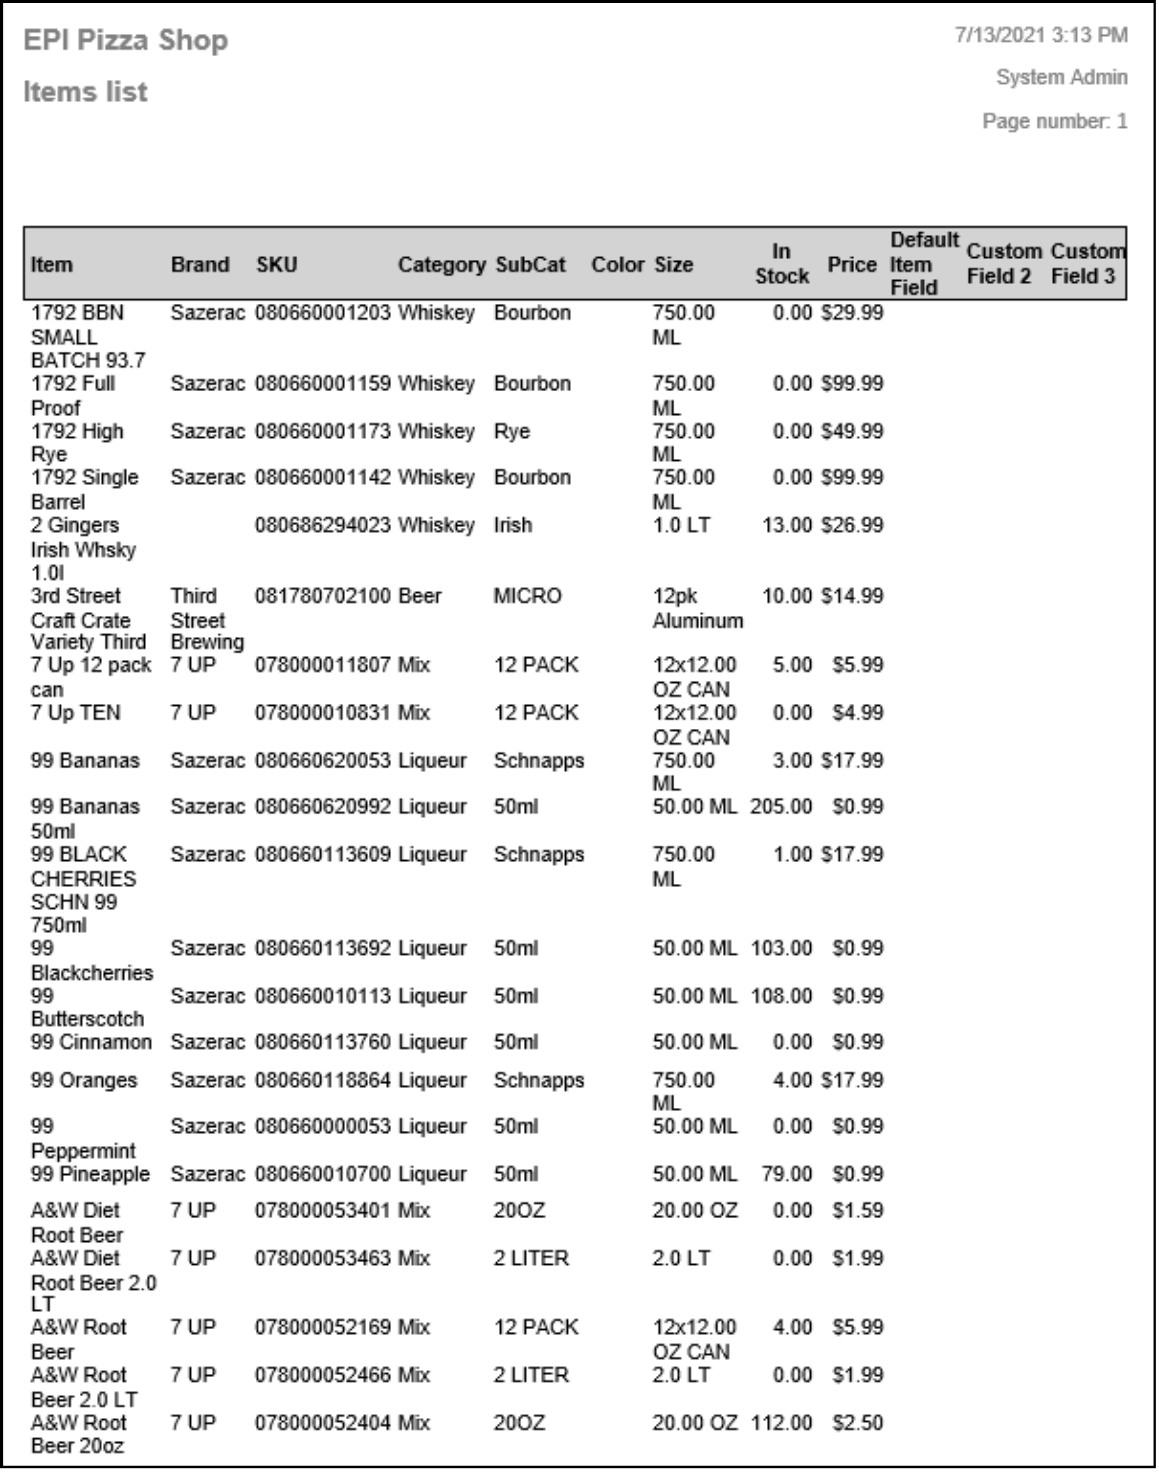
The Items Report provides merchants with a complete list of their items saved in Exatouch.
- Item – Item Name.
- Brand – Item’s manufacturer.
- SKU – Primary Sku.
- Category – Category to which the item belongs.
- SubCat – The Sub Category The item belongs in.
- Color – Color description.
- Size – Size set on the item.
- In Stock – The quantity saved in stock.
- Price – The price the item is sold for.
- Default Item Field – Custom field for the merchant to add to their items.
- Custom Field 2 & 3 – Two more custom fields.
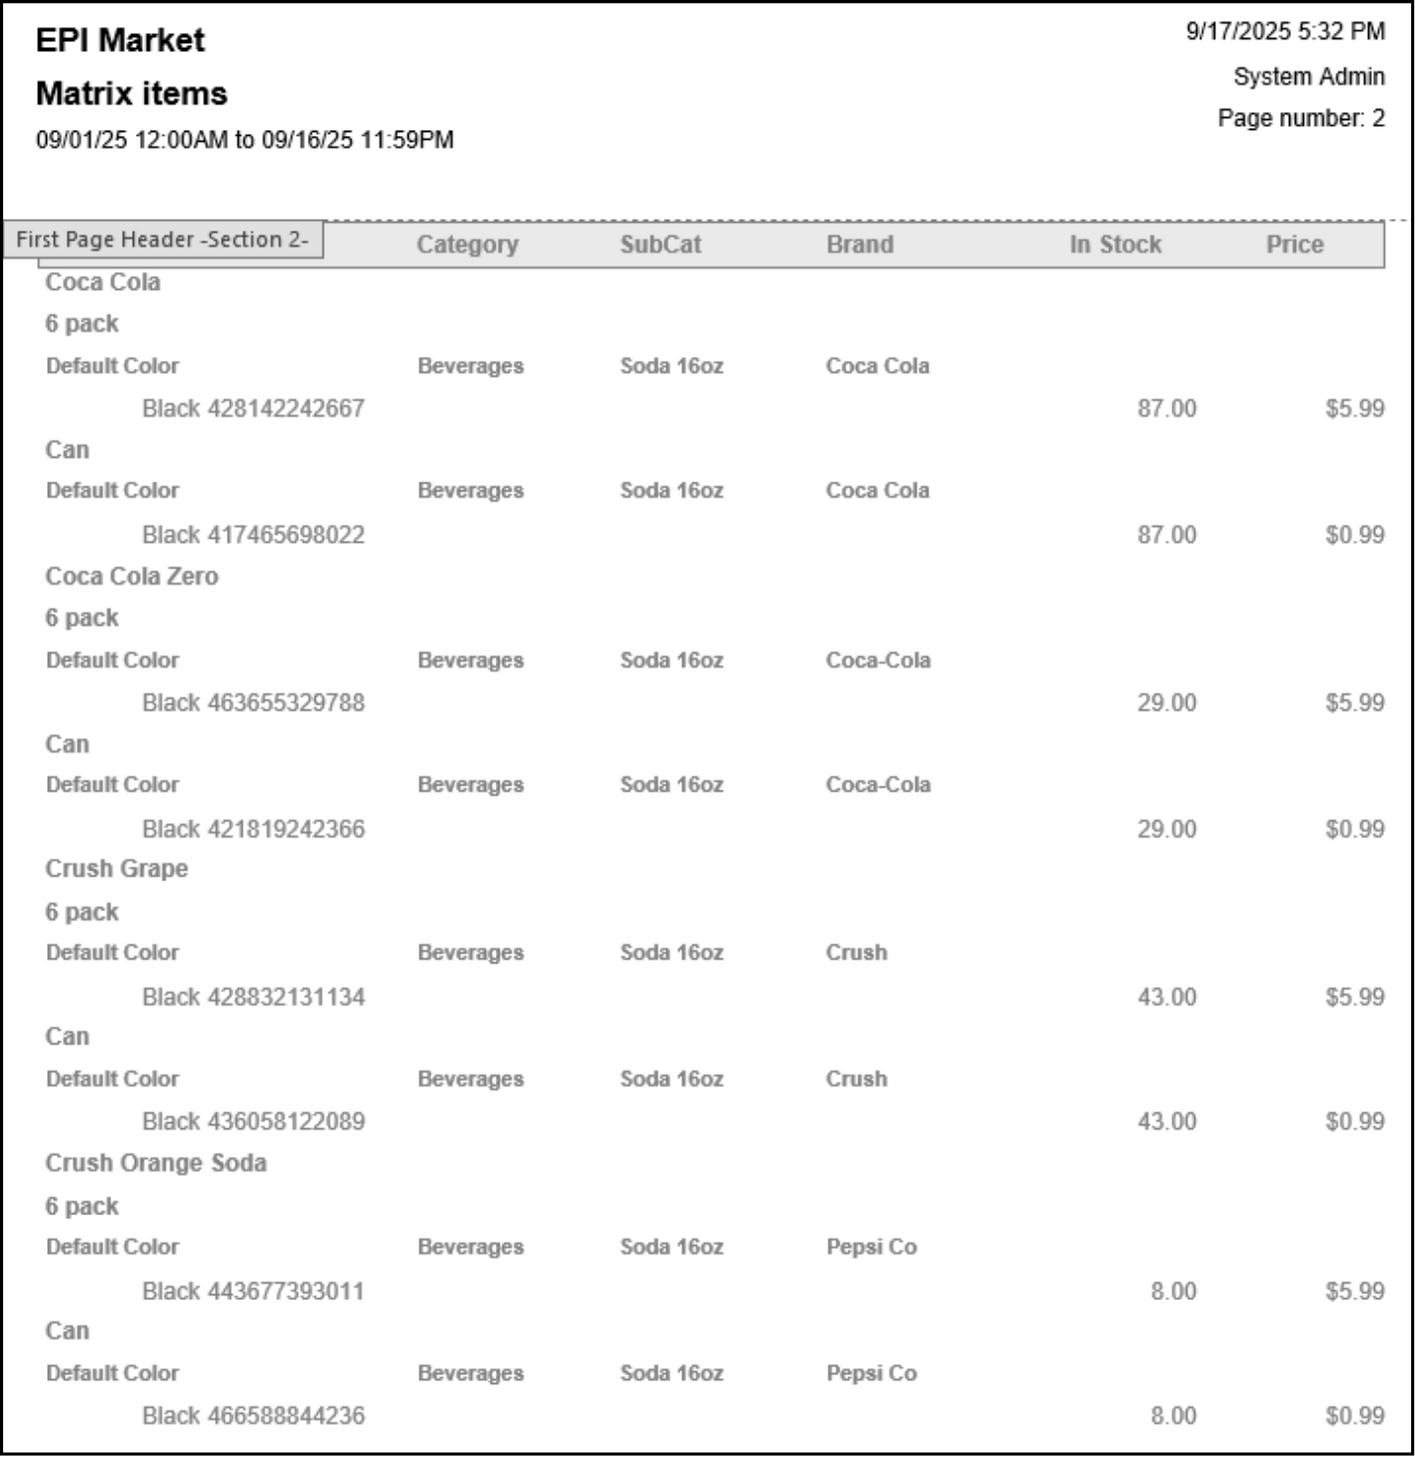
The Matrix Items Report provides users a list of Matrix Items with their relevant information visible.
- Style – Under the style column, the user will see Matrix Groups with their Members displayed beneath.
- SKU – The SKU for the Members will display but the Group’s SKU will not display.
- Category – Category selected on the item.
- Sub Cat – Sub Category selected on the item.
- Brand – The Manufacturer selected on the Item’s Inventory tab.
- In Stock – the quantity on hand for the Matrix Member. In stock quantity will not show if added to a group.
- Price – Price saved for the Matrix Member. The price will not show if added to a Matrix Group.
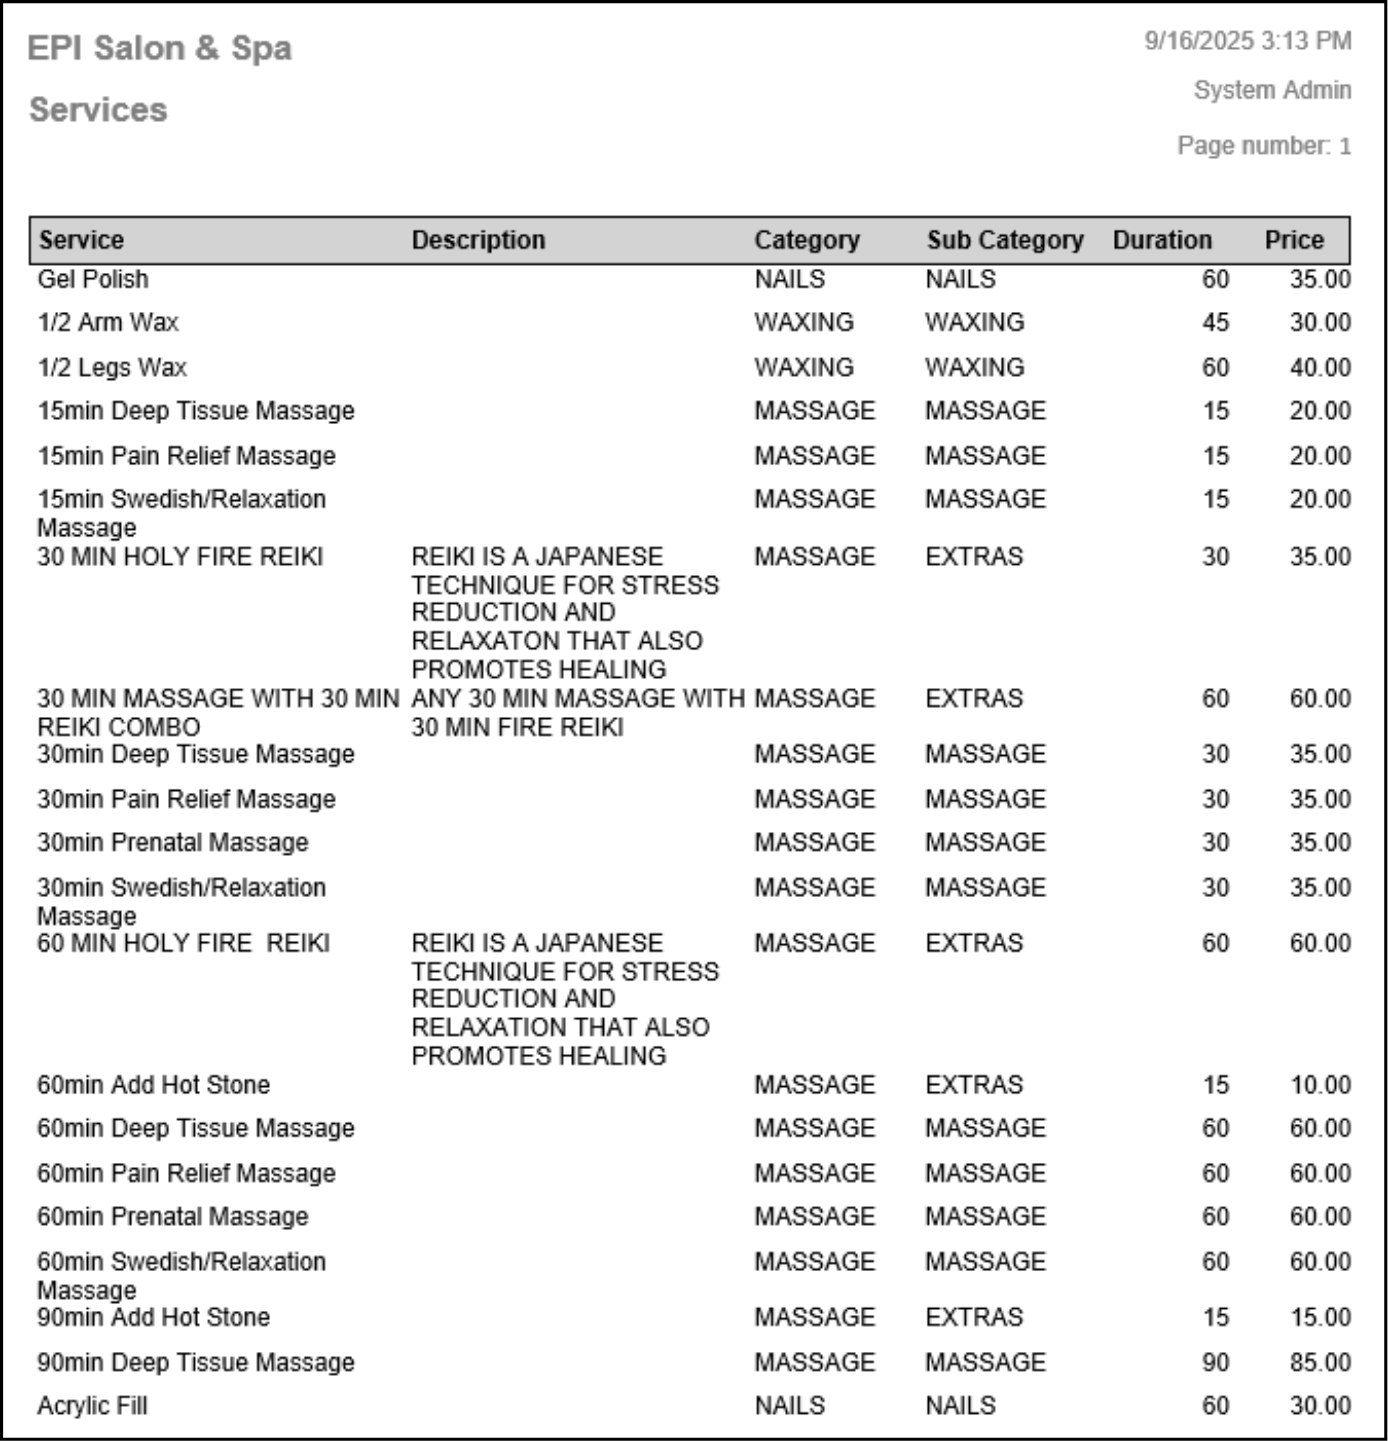
The Services Report provides merchants with a complete list of their services saved in Exatouch.
- Service – Service name.
- Description – Service’s complete description.
- Category – Category the service belongs.
- Sub Category – The Sub Category The service belongs in.
- Duration – The about of the time service if for.
- Price – The sale price of the service.
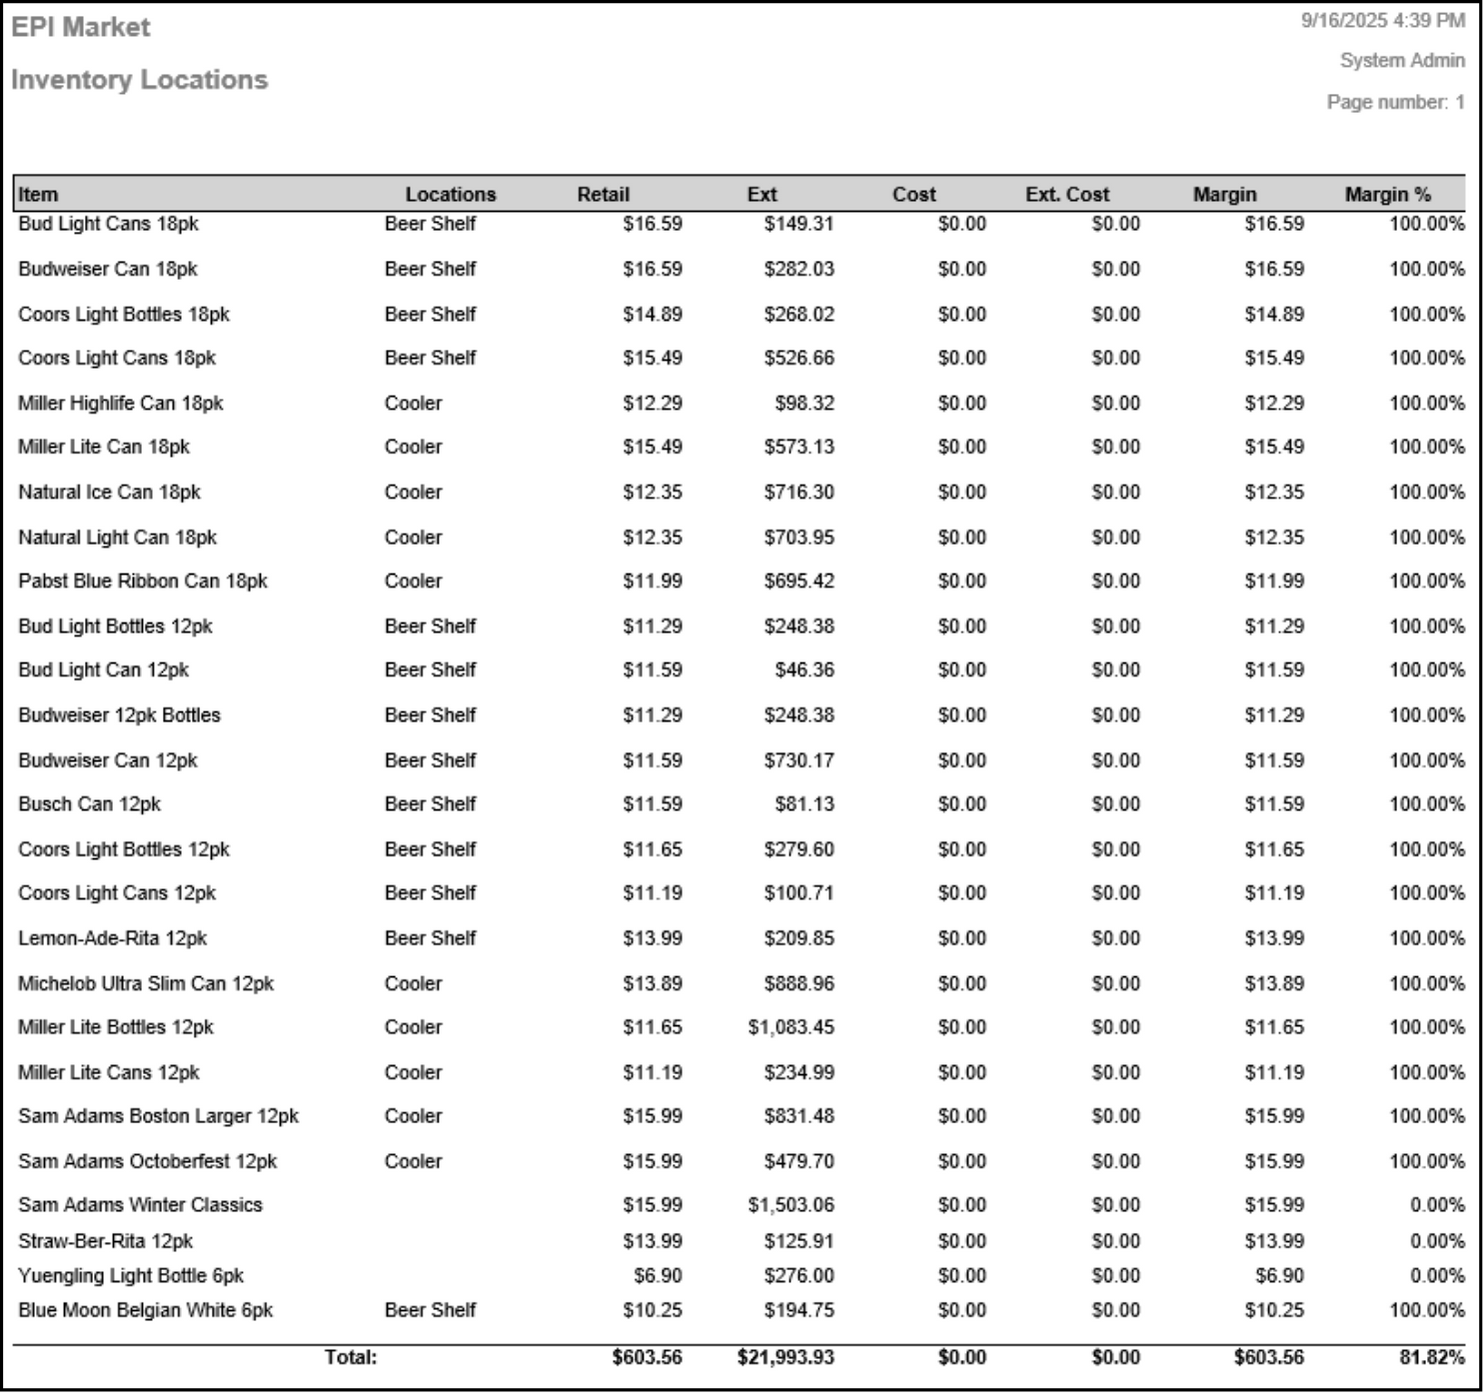
The Stock Locations Report helps merchants track where items are stored within their store, restaurant, or warehouse. All items appear on the report, even if no stock location is saved. Merchants can assign up to three stock locations per item.
- Item – The item description.
- Locations – Will display the stock location saved on the Items Details page. If there is no location the item will show but this field will be blank.
- Retail – The items sale price without any taxes and fees applied.
- Ext. – Retail price multiplied by the quantity on hand.
- Cost – The cost selected on the Items Details page. This can be the User Entered, Average, Recently, or Least Paid.
- Ext. Cost – Cost multiplied by the quantity on hand.
- Margin – The difference between the Retail price and the merchant Cost.
- Margin % – Margin percentage made each time the item is sold.
How can we improve this information for you?
Registered internal users can comment. Merchants, have a suggestion? Tell us more.